Saturday, March 17, 2018

Financial Astrology - March 19, 2018


Our posts are now reported on the highly regarded FXStreet.com.

SP500

The last Primary cycle low was February 9th. The standard for the Primary cycle is 18 weeks. We appeared to have put in the Primary cycle trough on February 9th at a low of 2532.69. This was late at the 23th week but this may be distorted as there are other longer-term cycles due. This may have been the 9-month cycle trough as well. Longer tern cycles may push the Primary cycle further out.

The SP500 Primary cycle has a range from 15 to 23 weeks so we were at the limit. The high for this Primary cycle was 2872.87 on January 26th. The high for the COMPQX was Friday March 9th as of this writing.

This puts us 5 weeks along in a new Primary cycle. We often get a short pull back in the 2nd to 3rd week at the start of a new Primary cycle. We may have just seen that pull back, remembering the longer-term cycles may push the Primary cycle out further.

We should be watching for a potential pull back into the 6th week trough remembering we could get a 9 – 9 ½ week cycle instead. The 6 and 9 and 9 ½ are sub cycles of the Primary cycle.

The key Astro activity over the next couple of weeks are the Sun and Mars changing signs, Mercury turning retrograde and Mars aspects. Mars is about to get more active as it makes a number of aspects to other key planets.

March 17         Mars enters Capricorn.
                        Mars, being energetic, forceful, violent, destructive, and strongly discordant.
Mars powered by Capricorn has a quiet strength that you sense and know not to mess with. The will of Mars is strong, this being a cardinal sign. It's also one with a lot of patience, and the ability to deny short term gratification, in favor of something down the road. 

March 20         The Sun is thought, politics and executive and administration. In politics, bosses and the ruling class. Mars add strength and fortitude. Sun the Aries, the spring equinox, Mars rules Aries. The Sun in sign of Mars has strength

March 22         Mercury turns retrograde
Mercury goes retrograde approx. every 3 months and stays retrograde for 19 to 24 days. Mercury rules correspondence, commerce, buying and selling, short term communication and negotiations. For trading don’t hold on to stocks too long.
                        Mars quintile Neptune
                        Confusion

March 23         Venus waxing square Pluto
Has a history of occurring unexpectedly? These tend to be strong signatures which can result in a sharp change in trend.
March 24         Sun squares Mars
                        This is the weakest of the Sun Mars aspects.

The last two weeks of March has challenging aspects from the FED natal chart to the current transits to that FED chart. I will base this on March 28th. Understand the aspects can affect a number of days either side.

Transiting Uranus in the 10th house squares natal Neptune in the 1st house. This could represent sudden change in politics in a country.

Transiting Venus in the 10th house conjuncts transiting Uranus. With the previous signature this could represent a change / problem in currency or money supply.

Transiting Pluto conjunct Jupiter has a strong history of powerful cycles in the US indices. Watch this with the previous signature. There may be problems with currencies.


The 15 day sma on the SP500 chart is flat to moving over. It is just below price. The 15 day sma is also below the 45 day sma which is flat and on price. I am looking for price to move down into a 6 week cycle trough.

Some of the cycles that are coming due are:
-       The Primary Cycle (nominal 18 week) on Feb 9th.
-       9 month cycle
-       5 week.
These are all coming due. See the charts below

The Primary Cycles


The week of Feb 4 had Pluto conjunct the heliocentric nodes of Pluto which should give Pluto more power. This was exact on Feb. 8th, 2018. This moves very slowly and I think the cause of the move down. The last time it occurred was Feb 20, 1772 just before 1776. This needs a broad orb +- weeks. There were a number of other factors pointing to a move down but Pluto conjunct the heliocentric nodes of Pluto seems most precise. For big moves there are usually multiple Astrological aspects and / or events.

Pluto stands for major change, breakdown and regeneration. Pluto can also stand for political breakdown, organized crime and secret intelligence. We have seen all the above in the US. Pluto also rules banking systems, stock and shares, manipulation and corruption. It was due. It could also be the source of the long move up. This Pluto aspect will be exact two more times in 2018 due to retrograde motion, July 11 and Dec 15th.

So we may see some sudden event early in the week indicating something has been overdone.

The 9 month cycle


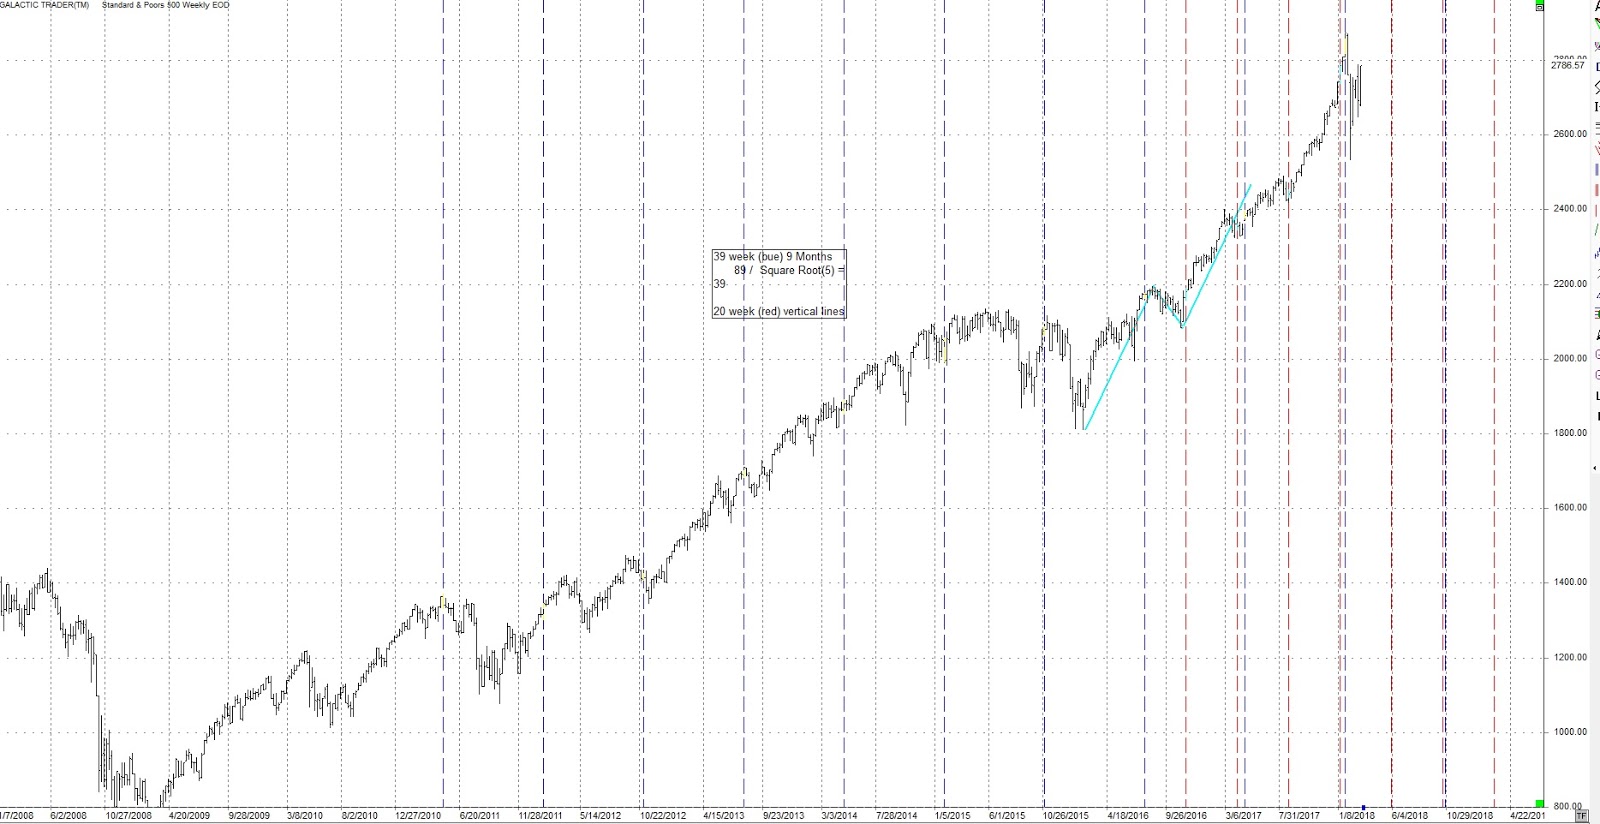
The above chart shows the 9 month or 39 week cycle (blue vertical lines). It is due and it was late but appears to be forming last week. The 20 week cycle was added as well (red vertical lines)

The 3.8 – 4 Year


The above weekly chart of the SP500 shows the synodic cycle for Mars and Vesta. The red circles are the conjunction of the two and the green double arrows are the middle of the cycle. These are the heliocentric aspects (Sun centered).

Note how the conjunction is often at a top with a quick decline. The next Mars / Vesta conjunction is April 23, 2018.

From the last few posts:
“This coming year could see an increase in geophysical activity, both earthquakes and volcanos.”

Following are the significant earthquakes (> 6.0) so far in January 2018.
Jan 23             Alaska                         7.9
Jan 10             Honduras                    7.5
Jan 14             Peru                            7.1
Jan 19             Mexico                        6.3
Jan 21             Chile                            6.3
Jan 25             Russia                         6.2

Feb 16             Mexico                        7.2
Feb 25             Papua New Guinea    7.5
There has been a number of volcano’s erupting as well.

On a longer term basis the following monthly chart of the DJIA  shows the 15 year cycle (red vertical lines) and the 45 year cycle (blue lines). The 15 year is due now, the 45 year due in Sept 2019.


In May Uranus will enter Taurus. Look for financial or banking system problems or changes. Uranus will go retrograde and then move backward into Aries before Uranus enters Taurus for good. This may also be a problem in currencies.

Generally speaking the first couple of months of 2018 should be volatile. There are 2 Super Moons and 2 Eclipses.

The above combination, with Saturn, could be defining problems / restrictions for the general population, particularly the mature population (pensions?) and with the Sun could affect the President or other leaders. This combination could affect a number of years in the future as Saturn is in a sign for approx. 2 ½ years. Other conditions this may highlight are State funerals, public sorrow and disappointment in general. State assets could be affected as well as industries connected to metals and mining.

The following monthly chart of the DJIA shows when Saturn has been in Capricorn (red x’s). Notice they have all had significant drops.


There could be some type of surprise coming in 2018 from the government or exposing something from the past. There could also be a major breakdown in world affairs or leaders.

The following daily chart of the SP500 shows the Jupiter price line (blue) and the Sun/Earth price line (green). Both of these price lines have a history of providing support and resistance.
When the two lines cross we often see a big range day or reversal. Note how price went down and stopped on the Sun / Earth Price Line. Price touched the Sun (thick blue) price line today but finished close to the next

The blue horizontal lines are the Jupiter price line. The thicker blue line just above price may act as solid resistance to any move up in price. The two lines will doss again on March 13 which is a trine between the Sun and Jupiter. This signature would typically be indicating a positive mood in the market but remember, Jupiter can stand for something that is overdone.


The month of March is open to high drama with possible major surprises out of Washington DC.

I continue to watch the 24th harmonic cycle (360 / 24) cycles for short term turns. The brown squares are Sun / Saturn 24 degrees on the following daily chart. The blue vertical lines are 24 cd’s (calendar days).

The next hit is March 29, 2018 and May 14, 2018  I have added 3 price lines to this chart.
-       Saturn – black
-       Uranus – purple
-       Neptune - light blue

Note the date, Feb 9th, 2018 was the day of the low and a big range day.

These price lines can act as support / resistance. It has been at highs and lows. Note also when they cross often gets a reaction in price on a short-term basis. Also note, near the top of the chart is a light blue line. This is the Neptune Price Line. Note how it has been strong resistance to price but has broken through. It should act as strong support when the market turns down.


Mercury Retrograde


This week we have Mercury turning retrograde on March 22nd. The inferior conjunction between Mercury and the Sun occurs on April 1st and Mercury turns direct again on April 15th. Any one of these three dates could see a change in trend close by. I have placed this description between the SP500 and Gold. The samples charts are for Gold.

As a reminder the two planets inside the Earth's orbit are Mercury and Venus. Both can have inferior and superior conjunctions depending on whether they are on the Earth’s side of the Sun or the far side of the Sun.

Inferior conjunction


Superior


The following chart shows Mercury retrograde (red arrow pointing left), Mercury turning direct (blue arrow pointing right), the geocentric inferior conjunction (small red circle) and the heliocentric conjunction (small blue circle) on the same day. They are on a daily Gold chart. Note the swings in the SP500 and Gold charts on any of those dates in the past.


This Mercury retrograde period is occurring in Aries, a Cardinal, Fire sign. Mercury also rules communication, commerce and trading, that is buying and selling. It has a reputation for problems, both communication, contracts and wrong decisions or choices. Pay close attention to moves in stocks or Gold when Mercury is retrograde. Note the 3 dates above. The Mercury retrograde period is known to be volatile.

Gold

Gold started a new Primary cycle on December 12.  We are entering the 13th week of a new Primary cycle. December 12 was close to the Mars entering Scorpio mentioned a few weeks ago.

Gold has been moving up as the US$ has moved down. It is important for Gold to stay above 1309. Look back to see days that could act as support around $1309.

We have seen the crest of the nominal 6-week cycle on January 25th and then a nominal 6 week cycle trough. To continue up, Gold needed to move above the Jan 25 high.
March 14th or early in the week may have been critical for precious metals.

Price is below the 45 sma and the 15 day sma. The 15 sma is curling over while the 45 day sma is moving sideways. This looks like Gold is trying to turn down.


The following chart shows seasonal tendencies for Gold. The 2nd half of the year, on average, is up.


The longer term.7.4 Year cycle is shown in the following weekly chart. Note we are still early in the latest 7.4 year cycle.


The following chart shows a 27 cd (calendar day) cycle (blue vertical lines). The next being March 13, 2018. The Moon takes 27 days to orbit the Earth and the Sun takes 27 days to revolve once at the Sun’s equator.

The red lines headed up are the Mars price lines. We went through the Mars price line. Moving below the dark red Mars price line was bearish now we need to move above the Mars price line. It may hit resistance. Price went through the next Mars price line and is sitting on it.

The 27cd cycle (Blue vertical line) showed a turn on March 13th. There was also a Jupiter semi-square Saturn signature on March 14th. These may have been the start of a move down. I was looking for this time frame to be a move up..

Looking at this whole chart it is based on a 24 harmonic. If you count each line from one darker red line to the next you will find there are 15 of them. 15 * 24 degrees = 360 degrees. Note price went down to Dec 12 where it bounced off a Mars Price Line.


The following daily chart of Gold shows the days Mars is entering a new sign (red squares). Look at this using +- 3 td’s (trading days). The last date was Jan 26th. These can be at highs or lows. Dec 8 was Mars entering Scorpio the sign that it rules.  Note on the chart, Mars changing signs, to any sign, often has a change in trend in Gold price. The blue circles highlight when Mars enters Scorpio, the sign that it rules. The last red circle shows Mars entering Sagittarius on January 26th. The next sign is Mars entering Capricorn on March 17th. Expect a change in trend.


Crude

We were looking at February 9th as being the trough of the Primary cycle. We are 5 weeks along, remembering we often get a pullback near the 1st 2 – 3 week period of a New Primary. Crude price has moved below the 45 day sma and the 15  day sma but made a strong move up on March 16th.

It is quite possible we make another low or at least attempt a low. Neptune rules Pisces, the sign it is currently in and Jupiter is the co-ruler. The week of March 12 had the Sun in trine with Jupiter just after it turned retrograde and thus appears slower than usual These signatures may affect the price of crude and / or NatGas.

The horizontal blue lines on the chart below are the average longitude of the planets Jupiter, Saturn, Uranus, Neptune and Pluto (blue). Note how price stopped on August 1 and August 31, right on the average longitude. See it again on Sept 14 and now Jan 16, 2018 which was also a 27 td (trading day’s). Now the last few days have got support at the blue planet average line as well.

The horizontal red lines are the Fibonacci retracement from Nov 14, 2016 to Feb 21, 2017.

Watch the red Fibonacci retracement lines and the blue planetary averages. Crude price made a strong move on Friday March 16.  I had expected some resistance at this level. Note the 15 and 45 day sma are curling over. The next level is currently at 64.68.


On the following daily chart of crude note the green lines sloping up. This is the price line for the Sun/Earth. The blue lines moving horizontal is the Pluto price line (blue). The Pluto price line acted as support on March 1st and 2nd and again on March 9th, although on March 9th crude made a strong move during the day.

Note how price often follows the Sun price line up and often stops and reverses at the Pluto price line. We often get big range days when the two lines cross, like October 27th.and Nov 22.

Watch March 23rd where the Sun price line crosses the Pluto price line. We often see a big range day or a change in trend.


Saturday, March 10, 2018

Financial Astrology - March 12, 2018


Our posts are now reported on the highly regarded FXStreet.com.

SP500

The last Primary cycle low was August 21st, the day of the Total Solar Eclipse. The standard for the Primary cycle is 18 weeks. We appeared to have put in the Primary cycle trough on February 9th at a low of 2532.69. This was late at the 23th week but this may be distorted as there are other longer-term cycles due. This may have been the 9-month cycle trough as well. Longer term cycles may push the Primary cycle further out.

The SP500 Primary cycle has a range from 15 to 23 weeks so we were at the limit. The high for this Primary cycle was 2872.87 on January 26th. The high for the COMPQX was Friday March 9th as of this writing.

This puts us 4 weeks along in a new Primary cycle. We often get a short pull back in the 2nd to 3rd week at the start of a new Primary cycle. We may have just seen that pull back, remembering the longer-term cycles may push the Primary cycle out further.

Also, when the markets have a big down move, like we’ve seen, it will often go back and test the low again. Either a little above or below. I suspect we will test the recent low either early or late March 2018. For example, March 1st and 2nd we had Venus trine Jupiter then Mercury trine Jupiter. Jupiter is often recognized as optimistic, positive and prone to exaggeration. It can also represent that which has been overdone, and in the markets a move down to correct an exaggerated move.

This coming week will see:
Mar 11             Mars trine Uranus
                                    Sudden, excitable events. Acts of violence.
Mar 13             Sun trine Jupiter
                                    In this case, a hindrance to success. Lost position
                                    This time frame is affected by a number of Jupiter signatures.
Mar 13             Venus square Saturn
                                    Passing affection. Difficulty with money.
Mar 14             Jupiter semi-square (45 degrees) Saturn
Inconsistent success, business friction or difficulties.
Separation from a person. Change of residence.
Mar 17             Mars enters Capricorn.

The last two weeks of March has challenging aspects from the FED natal chart to the current transits to that FED chart.

The 15 day sma on the SP500 chart is moving up but still below the 45 day sma which is also rising. If we count back 15 td’s we see that price was lower than the current price, so when it is dropped the 15 day sma should move up. Similarly, when the day 45 days ago, if it is dropped it should have the effect of rising. Watch price action to see if price can break through the next Fibonacci level at 23.6%. If yes it may be headed to a new high. The Nasdaq put in a new high on Friday. This being the 4th week of a new Primary cycle indicates a bullish move. We may start seeing some resistance to a bullish move when we get to Tuesday / Wednesday.

Some of the cycles that are coming due are:
-       The Primary Cycle (nominal 18 week) on Feb 9th.
-       9 month cycle
-       5 week.
These are all coming due. See the charts below

The Primary Cycles


The week of Feb 4 had Pluto conjunct the heliocentric nodes of Pluto which should give Pluto more power. This was exact on Feb. 8th, 2018. This moves very slowly and I think the cause of the move down. The last time it occurred was Feb 20, 1772 just before 1776. This needs a broad orb +- weeks. There were a number of other factors pointing to a move down but Pluto conjunct the heliocentric nodes of Pluto seems most precise. For big moves there are usually multiple Astrological aspects and / or events.

Pluto stands for major change, breakdown and regeneration. Pluto can also stand for political breakdown, organized crime and secret intelligence. We have seen all the above in the US. Pluto also rules banking systems, stock and shares, manipulation and corruption. It was due. It could also be the source of the long move up. This Pluto aspect will be exact two more times in 2018. I will bring them up as we get closer after Pluto’s retrograde motion.

So we may see some sudden event early in the week indicating something has been overdone.

The 9 month cycle


The above chart shows the 9 month or 39 week cycle (blue vertical lines). It is due and it was late but appears to be forming last week. The 20 week cycle was added as well (red vertical lines)

The 3.8 – 4 Year


The above weekly chart of the SP500 shows the synodic cycle for Mars and Vesta. The red circles are the conjunction of the two and the green double arrows are the middle of the cycle. These are the heliocentric aspects (Sun centered).

Note how the conjunction is often at a top with a quick decline. The next Mars / Vesta conjunction is April 25, 2018.

From the last few posts:
“This coming year could see an increase in geophysical activity, both earthquakes and volcanos.”

Following are the significant earthquakes (> 6.0) so far in January 2018.
Jan 23             Alaska                         7.9
Jan 10             Honduras                    7.5
Jan 14             Peru                            7.1
Jan 19             Mexico                        6.3
Jan 21             Chile                            6.3
Jan 25             Russia                         6.2

Feb 16             Mexico                        7.2
Feb 25             Papua New Guinea    7.5
There has been a number of volcano’s erupting as well.

On a longer term basis the following monthly chart of the DJIA  shows the 15 year cycle (red vertical lines) and the 45 year cycle (blue lines). The 15 year is due now, the 45 year due in Sept 2019.


The markets may be volatile into March. In particular the end of March has significant transits concerning the FED. See the chart below. Both Venus and Uranus in the 10th will square Neptune in the 1st. More deception, uncertainty and illusion. The middle wheel is the Nata chart for the FED and the outer wheel the transiting planets. This could affect currencies, US$ and / or rates.


In May Uranus will enter Taurus. Look for financial or banking system problems or changes. Uranus will go retrograde and then move backward into Aries before Uranus enters Taurus for good. This may also be a problem in currencies.

Generally speaking the first couple of months of 2018 should be volatile. There are 2 Super Moons and 2 Eclipses.

The above combination, with Saturn, could be defining problems / restrictions for the general population, particularly the mature population (pensions?) and with the Sun could affect the President or other leaders. This combination could affect a number of years in the future as Saturn is in a sign for approx. 2 ½ years. Other conditions this may highlight are State funerals, public sorrow and disappointment in general. State assets could be affected as well as industries connected to metals and mining.

The following monthly chart of the DJIA shows when Saturn has been in Capricorn (red x’s). Notice they have all had significant drops.


There could be some type of surprise coming in 2018 from the government or exposing something from the past. There could also be a major breakdown in world affairs or leaders.

The following daily chart of the SP500 shows the Jupiter price line (blue) and the Sun/Earth price line (green). Both of these price lines have a history of providing support and resistance.
When the two lines cross we often see a big range day or reversal. Note how price went down and stopped on the Sun / Earth Price Line. Price touched the Sun (thick blue) price line today but finished close to the next

The blue horizontal lines are the Jupiter price line. The thicker blue line just above price may act as solid resistance to any move up in price. The two lines will doss again on March 13 which is a trine between the Sun and Jupiter. This signature would typically be indicating a positive mood in the market but remember, Jupiter can stand for something that is overdone.


The month of March is open to high drama with possible major surprises out of Washington DC.

I continue to watch the 24th harmonic cycle (360 / 24) cycles for short term turns. The brown squares are Sun / Saturn 24 degrees on the following daily chart. The blue vertical lines are 24 cd’s (calendar days).

The next hit is March 29, 2018 and May 14, 2018  I have added 3 price lines to this chart.
-       Saturn – black
-       Uranus – purple
-       Neptune - light blue

Note the date, Feb 9th, 2018 was the day of the low and a big range day.

These price lines can act as support / resistance. It has been at highs and lows. Note also when they cross often gets a reaction in price on a short-term basis. Also note, near the top of the chart is a light blue line. This is the Neptune Price Line. Note how it has been strong resistance to price but has broken through. It should act as strong support when the market turns down.


Gold

Gold started a new Primary cycle on December 12.  We are entering the 12th week of a new Primary cycle. December 12 was close to the Mars entering Scorpio mentioned a few weeks ago.

Gold has been moving up as the US$ has moved down. It is important for Gold to stay above 1309.

We have seen the crest of the nominal 6-week cycle on January 25th and then a nominal 6 week cycle trough. To continue up, Gold needs to move above the Jan 25 high. March 12th or early in the week may be a critical time for precious metals.

Price is below the 45 sma and the 15 day sma. The 15 sma is curling over while the 45 day sma is moving up. This looks like Gold is trying to turn down.


The following chart shows seasonal tendencies for Gold. The 2nd half of the year, on average, is up.


The longer term.7.4 Year cycle is shown in the following weekly chart. Note we are still early in the latest 7.4 year cycle.


The following chart shows a 27 cd (calendar day) cycle (blue vertical lines). The next being March 13, 2018. The Moon takes 27 days to orbit the Earth and the Sun takes 27 days to revolve once at the Sun’s equator.

The red lines headed up are the Mars price lines. We went through the Mars price line. Moving below the dark red Mars price line was bearish now we need to move above the Mars price line. It may hit resistance. Price went through the next Mars price line and is sitting on it.

Looking at this whole chart it is based on a 24 harmonic. If you count each line from one darker red line to the next you will find there are 15 of them. 15 * 24 degrees = 360 degrees. Note price went down to Dec 12 where it bounced off a Mars Price Line.


The following daily chart of Gold shows the days Mars is entering a new sign (red squares). Look at this using +- 3 td’s (trading days). The last date was Jan 26th. These can be at highs or lows. Dec 8 was Mars entering Scorpio the sign that it rules.  Note on the chart, Mars changing signs, to any sign, often has a change in trend in Gold price. The blue circles highlight when Mars enters Scorpio, the sign that it rules. The last red circle shows Mars entering Sagittarius on January 26th. The next sign is Mars entering Capricorn on March 17th. Expect a change in trend.


Crude

We were looking at October 6th as being the trough of the previous Primary cycle. The new Primary cycle started on February 9th. (see my note above on extending the Primary cycles). We are 4 weeks along, remembering we often get a pullback near the 1st 2 – 3 week period of a New Primary. Crude price has moved below the 45 day sma and the 15  day sma.

It is quite possible we make another low or at least attempt a low. Neptune rules Pisces, the sign it is currently in and Jupiter is the co-ruler. The week of March 12 has the Sun in trine with Jupiter just after it turned retrograde and thus appears slower than usual These signatures may affect the price of crude and / or NatGas.

The horizontal blue lines on the chart below are the average longitude of the planets Jupiter, Saturn, Uranus, Neptune and Pluto (blue). Note how price stopped on August 1 and August 31, right on the average longitude. See it again on Sept 14 and now Jan 16, 2018 which was also a 27 td (trading day’s). Now the last two days have got support at the blue planet average line as well. Monday / Tuesday should be important for Crude.

The horizontal red lines are the Fibonacci retracement from Nov 14, 2016 to Feb 21, 2017.

Watch the red Fibonacci retracement lines and the blue planetary averages. Crude price is currently moving down and may have reversed on March 9.  I had expected some resistance at this level. The next level is currently at 64.68.


On the following daily chart of crude note the green lines sloping up. This is the price line for the Sun/Earth. The blue lines moving horizontal is the Pluto price line (blue). The Pluto price line acted as support on March 1st and 2nd and again on March 9th, although on March 9th crude made a strong move during the day.

Note how price often follows the Sun price line up and often stops and reverses at the Pluto price line. We often get big range days when the two lines cross, like October 27th.and Nov 22. The next day they cross was February 27th

Watch March 23rd where the Sun price line crosses the Pluto price line. We often see a big range day or a change in trend.


Saturday, March 3, 2018

Financial Astrology - March 5, 2018


Our posts are now reported on the highly regarded FXStreet.com.

SP500

The previous Primary cycle low was August 21st, the day of the Total Solar Eclipse. The standard for the Primary cycle is 18 weeks. We appeared to have put in the Primary cycle trough on February 9th at a low of 2532.69. This was late at the 23th week but this may be distorted as there are other longer-term cycles due. This may have been the 9-month cycle trough as well. Longer tern cycles may push the Primary cycle further out.

The SP500 Primary cycle has a range from 15 to 23 weeks so we were at the limit. The high for this Primary cycle was 2872.87 on January 26th.

This puts us 3 weeks along in a new Primary cycle. We often get a short pull back in the 2nd to 3rd week at the start of a new Primary cycle. We may have just seen that pull back, remembering the longer-term cycles may push the Primary cycle out further.

Also when the markets have a big down move, like we’ve seen, it will often go back and test the low again. Either a little above or below. I suspect we will test the recent low either early or late March 2018. For example, March 1st and 2nd we had Venus trine Jupiter then Mercury trine Jupiter. Jupiter is often recognized as optimistic, positive and prone to exaggeration. It can also represent that which has been overdone, and in the markets a move down to correct an exaggerated move. March 1-3 is also the time of a perigee Full Moon. Watch this time frame closely.

This coming week will see Jupiter turning retrograde on March 8th.. This is often found close to a Primary cycle crest or trough. I'm looking for a trough +- 5 tds around March 8th.

From four weeks ago post:
“We should watch for a cycle down. A 5 - 10 % correction would be healthy for the market at this point. I’ve put on a Fibonacci retracement. We often go down to the “box” which in the case would include the 38.2% retracement down to the 50% retracement. It may end sooner. Ideally, I would like to see price move below the 45 day moving average (the blue line). We should also consider a quick reversal back up. This has been a very strong move.”

Some of the cycles that are coming due are:
-       The Primary Cycle (nominal 18 week).
-       9 month cycle
-       5 week.
These are all coming due. See the charts below

The Primary Cycles


The week of Feb 4 had Pluto conjunct the heliocentric nodes of Pluto which should give Pluto more power. This was exact on Feb. 8th, 2018. This moves very slowly and I think the cause of the move down. The last time it occurred was Feb 20, 1772 just before 1776. This needs a broad orb +- weeks. There were a number of other factors pointing to a move down but Pluto conjunct the heliocentric nodes of Pluto seems most precise. For big moves there are often multiple Astrological aspects and / or events.

Pluto stands for major change, breakdown and regeneration. Pluto can also stand for political breakdown, organized crime and secret intelligence. We have seen all the above in the US. Pluto also rules banking systems, stock and shares, manipulation and corruption. It was due. It could also be the source of the long move up. This Pluto aspect will be exact two more times in 2018. I will bring them up as we get closer after Pluto’s retrograde motion.

The move down in the SP500 and other indices and commodities may be early as the month of March looks treacherous both early and late in the month of March. Sharp moves down like we have just seen often sees the markets go down and retest the low. Watch for this in March. This may change the date for the trough in the SP500 and other indices and commodities.

The move down reminds me of a number of “W” bottoms. Following are two W bottoms, one starting in August 2015 and the other starting late December 2015.


The 9 month cycle


The above chart shows the 9 month or 39 week cycle (blue vertical lines). It is due and it was late but appears to be forming last week. The 20 week cycle was added as well (red vertical lines)

The 3.8 – 4 Year


The above weekly chart of the SP500 shows the synodic cycle for Mars and Vesta. The red circles are the conjunction of the two and the green double arrows are the middle of the cycle. These are the heliocentric aspects (Sun centered).

Note how the conjunction is often at a top with a quick decline. The next Mars / Vesta conjunction is April 25, 2018.

From the last few posts:
“This coming year could see an increase in geophysical activity, both earthquakes and volcanos.”

Following are the significant earthquakes (> 6.0) so far in January 2018.
Jan 23             Alaska                         7.9
Jan 10             Honduras                    7.5
Jan 14             Peru                            7.1
Jan 19             Mexico                        6.3
Jan 21             Chile                            6.3
Jan 25             Russia                         6.2

Feb 16             Mexico                        7.2
Feb 25             Papua New Guinea    7.5
There has been a number of volcano’s erupting as well.

On a longer term basis the following monthly chart of the DJIA  shows the 15 year cycle (red vertical lines) and the 45 year cycle (blue lines). The 15 year is due now, the 45 year due in Sept 2019.


The markets may be volatile into March. In particular the end of March has significant transits concerning the FED. See the chart below. Both Venus and Uranus in the 10th will square Neptune in the 1st. More deception, uncertainty and illusion. The middle wheel is the Nata chart for the FED and the outer wheel the transiting planets. This could affect currencies, US$ and / or rates.


In May Uranus will enter Taurus. Look for financial or banking system problems or changes. Uranus will go retrograde and then move backward into Aries before Uranus enters Taurus for good. This may also be a problem in currencies.

Generally speaking the first couple of months of 2018 should be volatile. There are 2 Super Moons and 2 Eclipses.

The above combination, with Saturn, could be defining problems / restrictions for the general population, particularly the mature population (pensions?) and with the Sun could affect the President or other leaders. This combination could affect a number of years in the future as Saturn is in a sign for approx. 2 ½ years. Other conditions this may highlight are State funerals, public sorrow and disappointment in general. State assets could be affected as well as industries connected to metals and mining.

The following monthly chart of the DJIA shows when Saturn has been in Capricorn (red x’s). Notice they have all had significant drops.


There could be some type of surprise coming in 2018 from the government or exposing something from the past. There could also be a major breakdown in world affairs or leaders.

The following daily chart of the SP500 shows the Jupiter price line (blue) and the Sun/Earth price line (green). Both of these price lines have a history of providing support and resistance.
When the two lines cross we often see a big range day or reversal. Note how price went down and stopped on the Sun / Earth Price Line. Price touched the Sun (thick blue) price line today but finished close to the next

The blue horizontal lines are the Jupiter price line. The thicker blue line just above price may act as solid resistance to any move up in price.


The month of March is open to high drama with possible major surprises out of Washington DC.

I continue to watch the 24th harmonic cycle (360 / 24) cycles for short term turns. The brown squares are Sun / Saturn 24 degrees on the following daily chart. The blue vertical lines are 24 cd’s (calendar days).

The next hit is March 29, 2018 and May 14, 2018  I have added 3 price lines to this chart.
-       Saturn – black
-       Uranus – purple
-       Neptune - light blue

Note the date, Feb 9th, 2018 was the day of the low and a big range day.

These price lines can act as support / resistance. It has been at highs and lows. Note also when they cross often gets a reaction in price on a short-term basis. Also note, near the top of the chart is a light blue line. This is the Neptune Price Line. Note how it has been strong resistance to price but has broken through. It should act as strong support when the market turns down.


Gold

Gold started a new Primary cycle on December 12.  We are entering the 11th week of a new Primary cycle. December 12 was close to the Mars entering Scorpio mentioned a few weeks ago.

Gold has been moving up as the US$ has moved down. It is important for Gold to stay above 1309.

We have seen the crest of the nominal 6-week cycle on January 25th and then a nominal 6 week cycle trough. To continue up, Gold needs to move above the Jan 25 high.

Price is below the 45 sma and the 15 day sma. The 15 sma is flat while the 45 day sma is moving up.

Monday could be an important day for Gold. Watching to see if price can move above the 45 day sma.


Most charts we include are based on geocentric or Earth centered charts. We can also look at the Zodiac using heliocentric or Sun centered astrology. We often see a move in Gold when heliocentric Mercury enters heliocentric Sagittarius. It did so on January 19th and will be there until January 29. This can be a time of volatility and change for both stocks and precious metals.

The following chart shows seasonal tendencies for Gold. The 2nd half of the year, on average, is up.


The longer term.7.4 Year cycle is shown in the following weekly chart. Note we are still early in the latest 7.4 year cycle.


The following chart shows a 27 cd (calendar day) cycle (blue vertical lines). The next being March 13, 2018. The Moon takes 27 days to orbit the Earth and the Sun takes 27 days to revolve once at it's equator.

The red lines headed up are the Mars price lines. We went through the Mars price line. Moving below the dark red Mars price line was bearish now we need to move above the Mars price line. It may hit resistance. Price went through the next Mars price line and on Friday moved above it.

Looking at this whole chart it is based on a 24 harmonic. If you count each line from one darker red line to the next you will find there are 15 of them. 15 * 24 degrees = 360 degrees. Note price went down to Dec 12 where it bounced off a Mars Price Line.


The following daily chart of Gold shows the days Mars is entering a new sign (red squares). Look at this using +- 3 td’s (trading days). The last date was Jan 26th. These can be at highs or lows. Dec 8 was Mars entering Scorpio the sign that it rules.  Note on the chart, Mars changing signs, to any sign, often has a change in trend in Gold price. The blue circles highlight when Mars enters Scorpio, the sign that it rules. The last red circle shows Mars entering Sagittarius on January 26th. The next sign is Mars entering Capricorn on March 17th.


Crude

We were looking at October 6th as being the trough of the previous Primary cycle. The new Primary cycle started on February 9th. (see my note above on extending the Primary cycles). We are 3 weeks along, remembering we often get a pullback near the 1st 2 – 3 week period of a New Primary. Crude price has moved below the 45 day sma and the 15  day sma.

It is quite possible we make another low or at least attempt a low. Neptune rules Pisces, the sign it is currently in and Jupiter is the co-ruler. The first week in March has the Sun conjunct Neptune on March 4th and Jupiter turning retrograde on March 8th. These signatures may affect the price of crude.

The horizontal blue lines on the chart below are the average longitude of the planets Jupiter, Saturn, Uranus, Neptune and Pluto (blue). Note how price stopped on August 1 and August 31, right on the average longitude. See it again on Sept 14 and now Jan 16, 2018 which was also a 27 td (trading day’s). Now the last two days have got support at the blue planet average line as well.

The horizontal red lines are the Fibonacci retracement from Nov 14, 2016 to Feb 21, 2017.

Watch the red Fibonacci retracement lines and the blue planetary averages. Crude price is currently moving up I had expected some resistance at this level. The next level is currently at 64.75..


On the following daily chart of crude note the green lines sloping up. This is the price line for the Sun/Earth. The blue lines moving horizontal is the Pluto price line (blue). The Pluto price line acted as support on March 1st and 2nd.

From last week:
“Watch this closely as price may go through the Pluto price line quickly,”

Crude price went through approx. 3 Pluto price lines and now bounced up and stopped on the Sun price line (green). We may get resistance here and possible move down.

Note how price often follows the Sun price line up and often stops and reverses at the Pluto price line. We often get big range days when the two lines cross, like October 27th.and Nov 22. The next day they cross was February 27th

Watch Feb 27th where the Sun price line crosses the Pluto price line. We often see a big range day or change in trend.