Thursday, September 30, 2010

Early October Change In Trend

I originally had the Venus retrograde period around Oct 8th as a low. I’m now looking at it as a potential big CIT, which could be a combo turn and affect stocks, Gold, Oil and other commodities and currencies.

As I have written before Venus returns to approximately the same position every 8 years so Sept 2002 was the last time it went retrograde in this area. This doesn’t necessarily mean this will be a low but with the other Astro activity I was looking for a CIT.

In addition to the Venus retrograde we also have Venus sesquisquare (135 degrees) on Oct 7 and Oct 12. Preceding the retrograde, Venus is conjunct Mars on Oct 3 which has had a history of coinciding with Gold turns. This conjunction is somewhat different than normal as Mars is moving faster than Venus, due to Venus slowing down for it’s retrograde station. The effect is Mars is overtaking Venus.

Oct 7 also has a perigee new Moon (closest pass to earth) and is often a big range day.

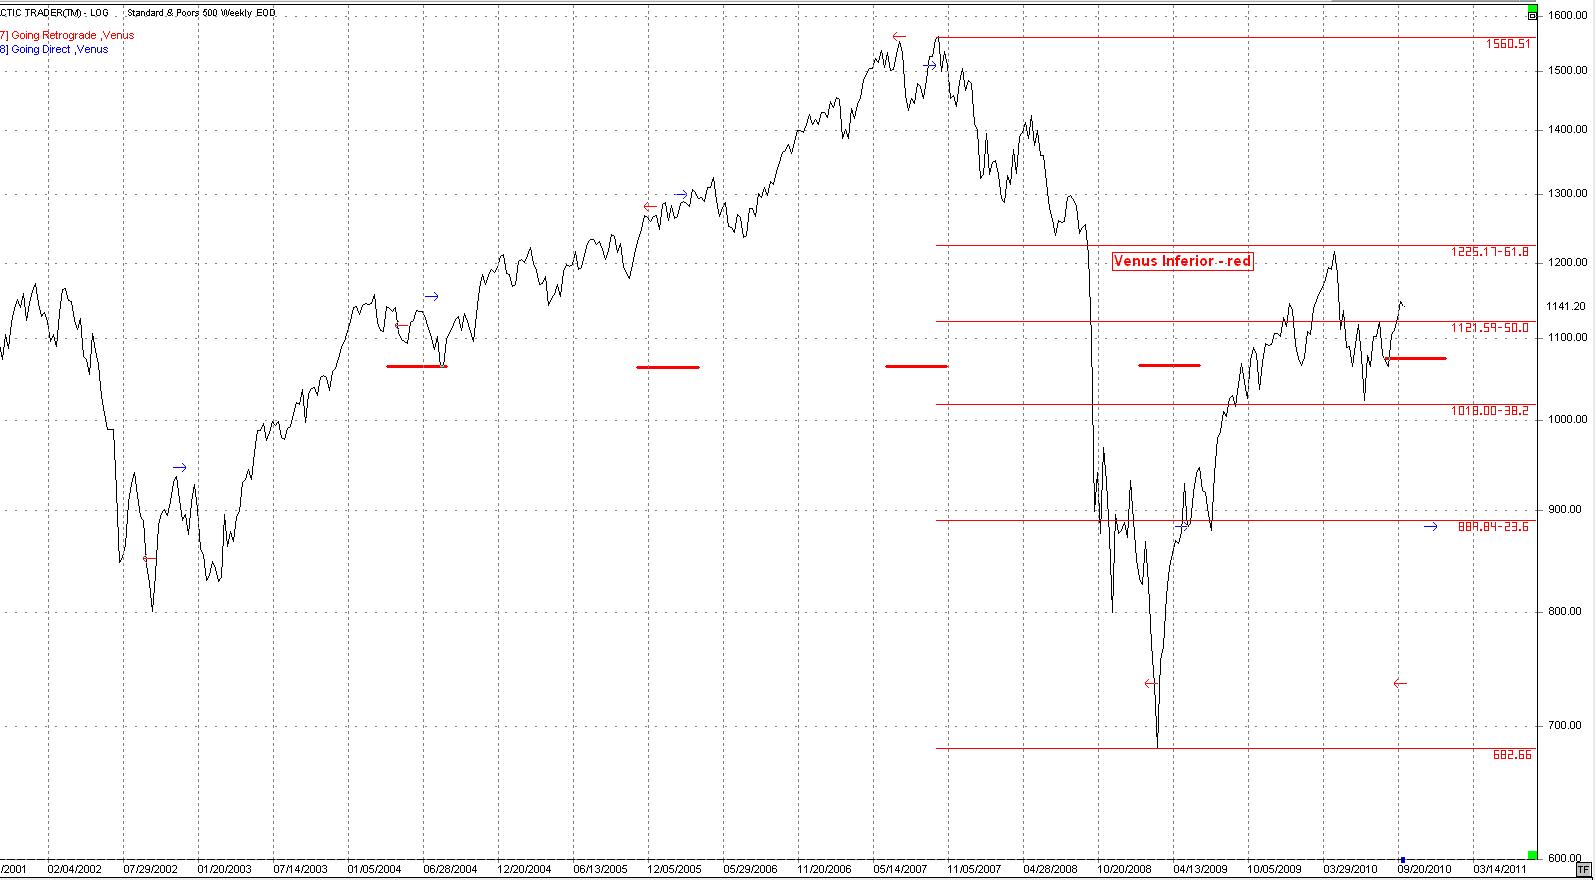
Following are weekly charts for the SP500, Gold and US$ showing the recent Venus retrograde history. The red arrow shows retrogrades and the blue directs.

SP500


US$


Gold


I’m looking at the period around Oct 22 and Nov 22 as potential lows and maybe a double bottom, after which we should get a significant rise. The period around Dec 21 may also be significant.

Thursday, September 23, 2010

September 24

For those who have been short we may be rewarded, well.... shortly.

The Summation Index has just turned down and the VIX registered a touch of it's lower Bolinger Band a few days ago which is often a signal for a fall in stock indexes.

The attached daily chart shows what can be done with simple parallel lines at 90 degree angles. We have been waiting for the SP to get up to the green line. It so happens it is almost at a 54 td cycle (vertical red lines).

We are looking for this line to act as firm resistance. If it is broken it is a sign the bulls are taking charge.

Monday, September 20, 2010

September 20

Be careful. The SP500 breaking through resistance at 1130 is very bullish. This has marked the highs for a number of months.

I am still playing this as a short, however, I may be covering quickly if volume picks up to the up-side.

Tuesday, September 14, 2010

Week of Sept 13, 2010

This should be a volatile week in the markets we follow. That is the SP500, Gold and Oil.

All 3 are entering a period where reversals could take place quickly and sharply. The window to watch is Sept 16 - Sept 22 with emphasis on Sept 21.

This is not the crash expected later in the fall but a swift correction.

As stated in previous posts, this time frame Sept 16 - 22 is also a geophysical stress window as well.

Tuesday, September 7, 2010

Week of Sept 7, 2010

I've been looking at Sept 10/13 as a CIT for stocks and also Sept 17-21st. The following daily chart of the DJIA shows a 36 cd cycle due on those dates. High or Low? I am suspecting a high then a short down but waiting to see how the week develops. It could be a low.


Tomorrow morning, Sept 8 there is a perigee moon at 6:30am, New York time, almost on the Ascendant. This may lead to a very volatile opening or other event.

This should be a volatile month. Jupiter and Uranus are retrograde and will be conjunct on Sept 18, 2010. This conjunction takes place at 28Pisces43. This is the same position Uranus held on April 25, 2010, close to the start of the decline in stocks. Sept 17th is fib 55 td from the July 1st lows. This time period, Sept 17 - 21 should mark a CIT and could be very volatile. Sept 21 has the Sun opposing both Jupiter and Uranus very close to the Autumnal Equinox. In addition this is a signature for discoveries, scientific breakthroughs and, unfortunately geophysical activity as well.

Mars enters Scorpio on Sept 14 and out of Libra where it has been in it's detriment. This should enliven all martian activities

There are Astros pointing to a possible crest in Gold and Oil. Look for Sept 13, 14 for these turns.