Sunday, December 29, 2013

Financial Astrology - Dec. 29,2013

SP500
General
There are so many significant aspects coming up in the next weeks it's pointing to some type of larger event that could effect many markets.

To repeat, this blog changes on Jan 1, 2014 We will no longer provide turn dates for the SP500 as these are being sold for the first half of 2014 see -> 

For those that registered. We've been caught in the ice storm and mail has been received sporadically due to ice conditions.. All registrations that have been received have been acknowledged either by email (if supplied) or snail mail. For those mailing in registrations, you may want to consider a gmail account for future communication.

The main market indexes look like they are being pushed up into year end. Be very careful around here. They have gone further than I thought they would with the negative Astros around. I'm still short the SP500 and nervous. I also still have buy stops in on Gold and am long Crude.

Gold
Gold is currently 12 weeks along it's Primary cycle (nominal 18 week). We are also setting a long term 4.25 year cycle trough or just testing the low in late June 2013. This has been a very left translated cycle, starting on Oct 15th and putting in the high on Oct 28th.

We should be close to a bottom, either just put on in or a spike low this coming week then up. See the December posts for details of the Astrological events during this period. The Sun and Pluto are often active by transit during Gold turns are are repeated here.

Dec 30             Mars square Pluto
                        Sun square Uranus

Dec 31             Mercury conjunct Pluto sextile Mars

Jan 1                Sun conjunct Pluto
                        Venus quintile Uranus ( Venus was quintile Uranus on Dec 10th then                                 turned retrograde)
                       

Jan 1 is also a perigee New Moon which is conjunct to Pluto and on the heliocentric South Node of Jupiter

Jan 1 heliocentrically has the Earth at 11Cancer4 the exact position when Uranus and Pluto perfected the heliocentric waxing square on Nov 23, 2013.

Jan 1, 2014 or a few days around it should be an important time for many markets.

This period could bring in increased social unrest, financial problems and geophysical events.

Normally we would watch the 15dma and 45 dma to see if the 15dma can turn up and ideally pass the 45 dma on it's way down. In a surprise move this turn can happen very quickly. Hours rather than days.
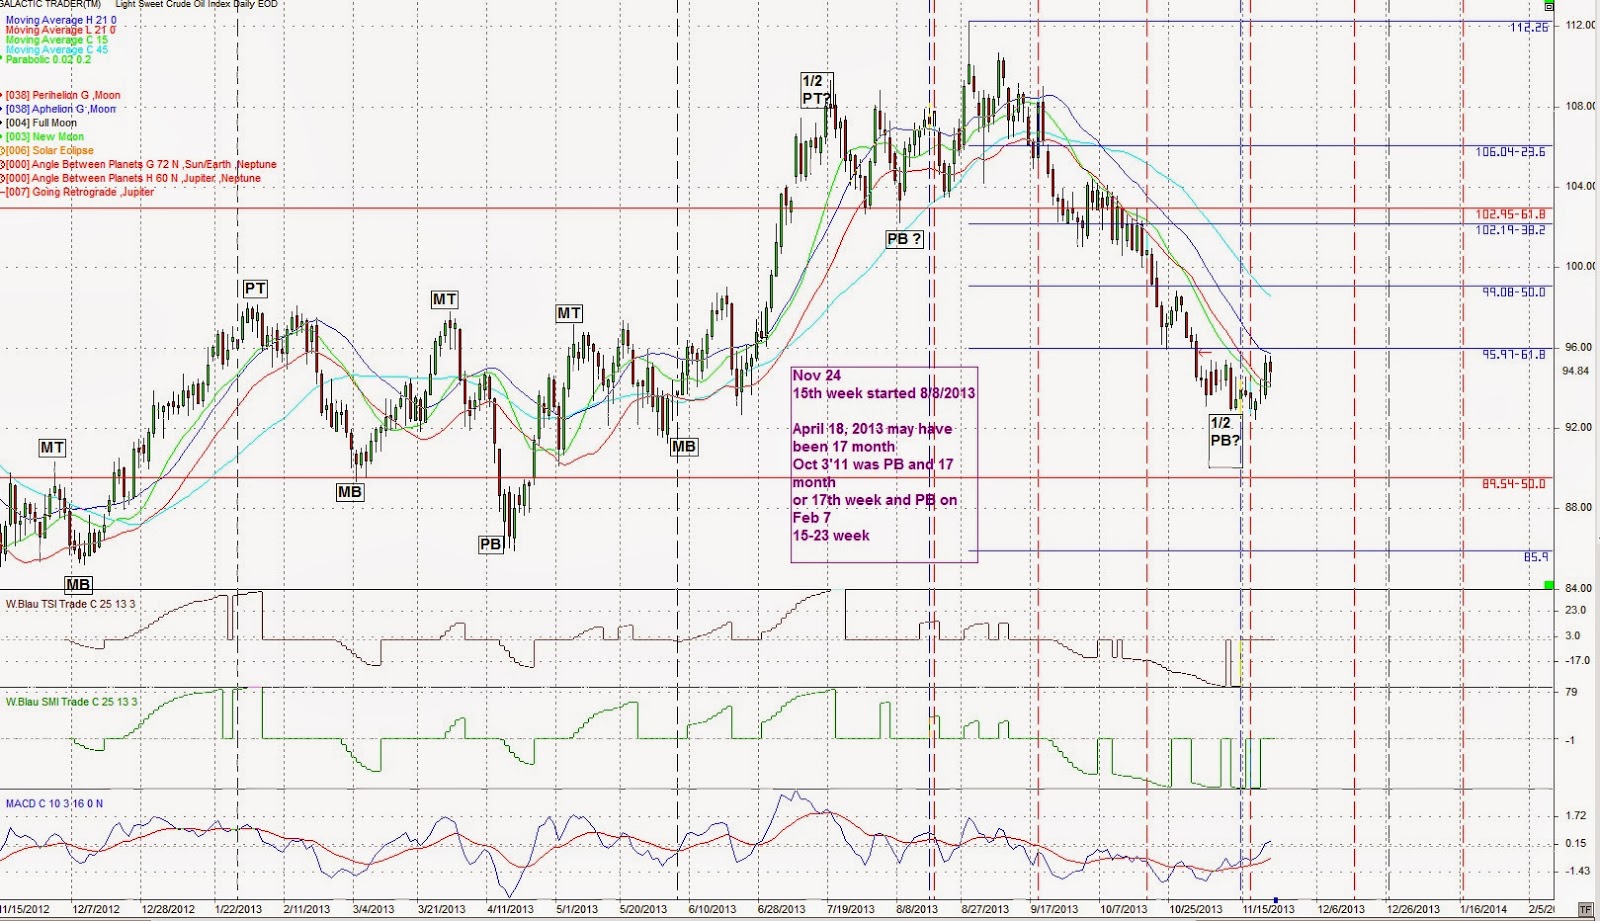


Crude

The following daily chart for crude shows crude has followed the Sun price line (green) up to the Pluto price line (dark blue). Note this is the main (darker) Pluto price line where events often happen. I expect a pullback here or a sharp move up through the Pluto price line. Of the two choices I'm leaning to a pullback which would satisfy the 16/24 week cycle and then probably up, but we will have to see more price action first.

This is the 5th week of the Primary cycle and due for a Major Cycle crest (nominal 6 week). It's due for a quick down turn.


Sunday, December 22, 2013

Financial Astrology - December 22, 2013

General
There are so many significant aspects coming up in the next 2 weeks it's pointing to some type of larger event that could effect many markets.

To summarize:
Dec 23 - after the Venus stationery retrograde while trine Admetos and parallel Pluto.       Also the Sun entering Capricorn.
Dec 24 - Sun opposition Hades
Dec 25 - Mars opposition Uranus
Dec 29 - Mercury squared Uranus
Dec 30 -Mars square Pluto
             Sun square Uranus
Dec 31 -Mercury conjunct Pluto and square Mars
Jan 1   -Perigee Moon on the heliocentric South Node of Jupiter and conjunct Pluto

It's hard to imagine something significant has not happened from the above, but it continues.
Jan 2   -Sun square Mars
Jan 5   -Sun opposition Jupiter
Jan 8-  Mars square Jupiter

That's enough for now. I'll be watching this tic by tic

SP500
This is the period I've been warning about for a number of posts. Tension is building up. With the FED still active it may take a surprise event to change the trend in the markets.
All comments from the December 1st post and on apply. I'm short the SP500 and nervous, especially since the FED (Uranus) based spurt. Also have buy stops in on Gold and am long Crude.

I'm watching European exchanges  more specifically for social unrest, banking or other type of significant event. See previous December posts.

27/54 week, we've moved a little higher but still within range.


Fib Extensions. We have broken above so we want to see a pull back shortly.


Gann Fan - still holding


US$
This may be bouncing from the Uranus stationary direct signature on Dec 17th or just following the FED bs and about to move sideways in congestion. The Jan 5th Sun opposition Jupiter and Jan 8 Mars square Jupiter could be near a high. If bigger world events are in the cards, they will tell which way the US buck will be moving.

Gold
Similar to the SP500 our comments for most of December still hold. A low is expected at any time. It may be a spike low then up. It is possible Gold's low waits until January but with the volatile aspects I would expect it at any time, possibly as early as Monday Dec 23, just after the Venus stationary retrograde. See previous December posts, if 1180 is broken on big volume get out.

25 week (red vertical lines) with Sun Jupiter opposition and Mars Opposition Uranus


Crude
I was looking for a high in Jan 6 to mid-January but could see significant volatility around Jan 6-8. Jupiter being the co-ruler of crude with Neptune. Could be defining the high.

Jan 5   -Sun opposition Jupiter

Jan 8-  Mars square Jupiter

16 and 24 week cycles converge the week of Jan 6, 2014

“To learn who rules over you, simply find out who you are not allowed to criticize.”
--Voltaire

Merry xMas

and to TEPCO Japan have a very mutant xMas
Why the good Japanese people put up with you is a mystery to me.


Thursday, December 19, 2013

Gold Update December 19, 2013

We are very close to a bottom in Gold or a crash. Watch the 1180 area which was the June 27, 2013 intra day low.

If Gold goes lower than 1180 on good volume watch out for a crash.

Venus turns retrograde on Dec 21 while parallel to Pluto and in a loose trine to Admetos. All have a history of turns in Gold prices.

In addition the Sun enters Capricorn. The Sun changing signs can be a CIT in many markets.

Wednesday, December 18, 2013

Update Dec 18, 2013

So many Astrological forecasters but no one venturing an opinion on the FED announcement at 2:00pm today.

Specific prediction is difficult.

Based on the FED chart and mid-point analysis this could indeed be a surprise and tapering is announced to start now or early in the New Year.

If instead Bernanke and Yellin stick with the current QE plan it will be seen as a big mistake within one month and the major markets will be headed down by January 18th at the latest.

If either of the above turns out to be correct it should be known it is my analysis and is based on the work of Reinhold Ebertin and his publication of "The Combination of Stellar Influences" first published in 1940.


Tuesday, December 17, 2013

Update December 17,2013

A reminder tomorrow is FED day.

Please re-read the Dec 1st post. You could also search previous posts for the "France" and "Europe".

I've been expecting severe social unrest and potentially banking problems. Another outlier is a nuclear incident. Watch the holiday season for news out of Europe and closer attention on France around January 1, 2014 +- a couple of days.

And    M E R R Y  X M A S


Sunday, December 15, 2013

Financial Astrology - December 15, 2013

This coming week could see a short term bounce Mon or Tues with Mercury moving out of bounds. The following daily chart of the SP500 shows red vertical lines where Mercury has gone out of bounds and back in. Unless the FED comes up with a big surprise the markets should continue down later in the week. Surprises are what Uranus turning stationary direct are all about so I would be careful ahead of the FED announcement on Dec 18.

Things should get intense. On New York time the Full Moon on Dec 17 is approx. 4:00am in the morning. The Sun will be close to the Galactic Center so things should feel intense. If there is a positive surprise I don't think it will carry the markets higher past the first week of Jan 2014 although some other work points to Jan 10 or 13 2014 I'm leaning to a market which continues down into a major correction but may have some up moves that can't be sustained.


To repeat from previous posts Dec 20 is quadruple witching and Venus is turning retrograde while parallel Pluto on Dec 21. This should be market moving. We then get into the translation of the Uranus / Pluto square, first by Mars and then the Sun. This should be a volatile period and possibly much more than the stock markets. The period is from Dec 24 through Jan 2nd and may be wider.

Following are the charts we have been showing for the SP500.

The 27/54 week cycle.

Fib extensions.

Gann Fan

If the the market breaks through the 45 degree angle on heavy volume it could be going higher and all bets are off.

If the SP500 breaks below the 1765-1766 area watch out.


To repeat, this blog changes on Jan 1. We will no longer provide turn dates for the SP500 as these are being sold for the first half of 2014 see -> 

January 1, 2014 has a powerful supermoon which is on the heliocentric south node of Jupiter and is very close to Pluto. I am repeating this event because it is so potent for the markets and possible other world events.

US$
See last US$ post here ->

The US dollar has been weakening but what is the alternative. With European problems on the horizon and the US weak economy it appears currencies will be a major theme and problem in 2014. One of the reasons I have been following Gold so closely. It's time may be coming back shortly. The following is a weekly chart of the US buck.


Gold
Gold is now in the 9th week of it's primary cycle. As mentioned in previous posts we are looking for a low on Dec 20/23 or closer to Dec 30. These dates are all +- a few days. Watch for a spike low. Watch for a daily low below the June 28 low and then rise above it. Also watch the 1250 area on the upside. It looks like firm resistance. Gold often moves on Mercury out of bounds dates mentioned above, but typically not a major move. The following weekly chart shows the 25 week cycle (red vertical lines) and the symbol with red double arrows is the Sun opposition to Jupiter on January 5, often closer to a more significant move.


Crude
The following weekly chart for crude shows the 16 and 24 week cycle meeting in early Jan 2014. I'm looking for a high early to mid Jan 2014. The following weekly chart for crude shows the expected high (green line, meeting of 16 and 24 week cycles).


Brief Notes for 2014

There may be problems originating in Europe. Severe social unrest, unemployment and banking. If there are banking problems there is a potential to spread to the US as the financial systems are so inter-connected.

The Uranus / Pluto square continues and with it secrecy and control issues by government and other large scale organizations. Eventually this square should produce astounding technological breakthroughs but first we must go through this period of change to the status quo. Social unrest and related violence could eventually hit the North American shores. The hidden unemployment picture in the US will eventually cause unrest there. Any countries where the people are not happy with their leaders can result in the rise and selection of new leaders who can turn out to be far worse. This scenario has been repeated so many times in history.

Other issues are Neptune in Pisces. Previous passages have equated to a rise in socialism,
and epidemics. Recently there have been aspects between Hades and Neptune. This could be a precursor to water or food pollution. This could be pollution as seen at Fukushima or water table pollution from fracking technology. Water will be a key issue in the near future. We are also in a period of increased geophysical stress and violent weather.

More in a future post.


Friday, December 13, 2013

Update - Financial Astrology - December 13, 2013

A note for new readers. The next few weeks could be momentous. There are many Astrological configurations pointing to a strong market move. Since a strong up move is hard to believe I'm looking down. The FED could surprise everyone in which case precious metals would be a place to be. We wait until the Dec 18th announcement.

One of many Astrological indicators is Uranus is turning direct in Aries, a Fire sign.

Uranus turned direct in Sagittarius, a Fire sign on Sept 1, 1987, just before the crash.

For you Fibonacci fans it has moved approx. 62% through the 360 degrees in that time.

I'm not predicting a crash on Dec 17. This is just another warning to be very careful. As written in a number of previous posts the rest of Dec and first week in January could be very volatile. I'm looking for a move down and I am now short the SP500.

Good luck.

“The ultimate test of all formulae must lie in prediction”
-- Dr. D Justin Schove

Saturday, December 7, 2013

Financial Astrology - December 8, 2013

This blog will change as of January 1, 2014. As we are selling the forecast dates for the general U.S market indexes, DJIA, SP500 and the Nasdaq they will not be forecasting them on this blog (see ->  http://www.trading-daze.blogspot.ca/2013/12/2014-offer-key-dates-1st-half-of-2014.html ).

Instead we will include a general astrological forecast for the coming week / month and will continue market forecasts for gold and crude.
The coming weeks in December and early January are potentially momentous. On Dec. 17th the FOMC meeting takes place while Uranus turns stationary direct and Venus turns stationary retrograde on Dec. 21st while in close trine to Admetos and the Sun changes signs into Capricorn. Sudden surprises and change to finances and something of a financial nature are strongly indicated. If it is the long awaited tapering announcement there may be a negative response in the markets. This, however, would hardly be a surprise. When everyone is expecting something it seldom moves the markets. No tapering announcement may give precious metals a reason to move up. I'm waiting to be surprised. If the markets go through a correction here I'm not expecting a major crash. It is a future event. The madness of the FED interference in the markets will be difficult to stop. It may be some unforeseen event that brings the market to it's senses.

The second half of December leading into early January look explosive. This covers many areas not just financial ones. This could cover severe storms, earthquakes, volcanic activity, terrorism, nuclear event or significant social unrest or shift in power I emphasize "may". Astrological prediction identifies approximate time periods and possible events. Forewarned is forearmed. This could be anywhere in the world.

Mars then the Sun will be translating the Uranus / Pluto waxing square starting the xMas week into Jan 2014.  Then on January 1st, 2014 there is a perigee new Moon (perigee meaning it's closest point to earth). This was coined a Supermoon some time ago by Astrologer Richard Nolle. This new Moon is also conjunct Pluto and both are almost conjunct the heliocentric South Node of Jupiter while being square to Mars. Mars is in Libra where it is in it's detriment, where it acts with the least power. All this is hitting planets in the formation charts of a number of countries. The U.S. and France come to mind but going through each countries chart is a formidable task which I won't be doing.

The heliocentric nodes are often not considered in astrological analysis. The South Node can be considered the negative pole where disintegration or loss take place. In Mundane Astrology Jupiter, ruler of Sagittarius, covers higher religion, the beliefs of the people which include submission to authority, the public faith, the court system, big business, higher education, banks, the banking system, inflation, wealthy people and foreign countries. 

This could be a very explosive situation. I don't get tied up to one day too often. There could be an event somewhere in the last 2 weeks of December or first week in January. The fact the fast moving Moon is involved and it's in perigee, could place the event close to Jan 1.

If no event is evident look for the start of something. I'll be watching news from the banking system, money and inflation. Think globally.

SP500
The following weekly chart of the SP500 is an updated chart showing the 27 / 54 week cycle. The red double arrow shows the Venus opposition to Jupiter which occurred on the heliocentric North Node of Pluto.


Other repeat charts for the SP500 showing resistance at the fib extension and another showing a Gann Fan with the 45 degree showing resistance. I'll be surprised if the SP500 breaks above the 45 degree line as shown.


US$
The following is an updated chart for the US$. To repeat the blue arrow pointed right is the Uranus stationary direct date on Dec 17th. This often marks an intermediate top or bottom within a few td's in the US buck. It appears to be weakening.


Gold
Gold is now in the 8th week of it's primary cycle and overdue for a trough. As mentioned in previous posts we are looking for a low on Dec 20/23 or closer to Dec 30. These dates are all +- a few days. Watch for a spike low. Watch for a daily low below the June 28 low and then rise above it. Also watch the 1250 area on the upside. It looks like firm resistance.


We could also see a spike close to Dec 13th.

Crude
Crude did move up sharply and we bought in. We may be in the 2nd week of a new primary cycle and could get a brief pull back. I look at this as another buying opportunity. The following weekly chart for crude shows the 16 and 24 week cycle meeting in early Jan 2014. I'm looking for a high early to mid Jan 2014


Article Bill Meridian on the FED
http://www.billmeridian.com/articles-files/fed-new.htm

“Nobody can hurt you without your permission.”
---- Mahatma Gandhi


Wednesday, December 4, 2013

2014 Offer - Key Dates 1st Half of 2014

For the first time since starting this blog in 2009, which has been free, I am going to charge for one service. That is the identification of key dates in the first half of 2014 which should be critical for the markets. Those who have followed this blog know there have been many exact hits that no one else has called. These dates are not all market related but should also identify key world events that will affect the markets. The same dates apply to the S&P500 and the NASDAQ.

There will not be a multi-page report just key dates and a couple of sentences on what to expect.

If you want these dates please send a cheque for $99.00 US to:

Gord Lawson
1888 Bowler Drive
Pickering, Ont. L1V 3E4
Canada

Please include your return address or eMail and the dates will be sent out immediately.

Your eMail will not be sold or given to anyone and you can choose to just send in your address. This is an honest site. Please don't distribute the dates. The less people who know them, the more effective they will be.

2014 and 2015 are shaping up to be a potentially momentous period. Knowing critical time periods before they arrive will let you use technical tools with the dates to take advantage of wild market swings.

Regards,

Gord Lawson aka tradingdaze
tradingdaze@gmail.com


Update Dec 4, 2013

In answer to a readers questions.

Tomorrow Venus comes back in from being out of bounds.

From a previous post.

Declination is the measurement of planets north or south of the celestial equator, which is the Earth"s equator extended into space.

Any planet that goes beyond the Sun's max declination is said to be "out of bounds". The Sun's maximum declination is 23 degrees 27 minutes.

This often results in big range days in a number of markets, particularly for precious metals.

Tuesday, December 3, 2013

Update December 3, 2013

I received some emails that tell me I was not clear.

Tops are always volatile and we are close for the general markets in the US. I am out except for some small crude holdings.

My message. I would get out. I'm talking about general US market indexes (stocks) and Gold. I will probably exit the crude holding shortly. There is simply more risk than reward. Obviously stocks with yield will fare better.

Very short term traders, be careful.

I'll let you know when I'm going short.

I will publish dates for 2014 within a week.

Good luck.


Sunday, December 1, 2013

Financial Astrology - December 1, 2013

I'm going to lump the 3 areas I cover into one group for this post. They are related.

As we enter a new month the general markets in the US continue their march higher and the FED, at the moment, continue with QE, in effect creating $85 billion new dollars per month. Other central banks around the world are printing as well so their currencies do not become too overvalued. against the US buck.

I'm continuing to watch the 27 week cycle (see the last post). I would give it a range of approx. 1 to 2 weeks either side. The markets are stretched and over bought, but with all the excess cheap money around they continue up past most thoughtful persons targets. The market could turn at any moment. When it does turn it could be sharp and fast. A 10-15% correction would be a good thing. I think a crash is a 2014 - 2015 event although I'm leaning to 2014. Following is an updated chart weekly chart of the SP500.


Note the low volume on this chart as prices rise.

Astrologically this month has four very important events. Even more important because they are so close to each other. These events are:

December 12 Jupiter in waning trine to Saturn

December 17 Uranus stationary direct

December 21 Venus stationary retrograde

Near the end of the month Mars will be translating the Uranus / Pluto square from Dec 25 to Dec 30 and the Sun will translate the same square on Dec 30 through Jan 1, 2014. It could be an explosive holiday period, but before we get there lets review the first 3 dates above. This period, in late December could hit Europe the worst with France standing out.

This square highlights the issues of social unrest / unhappiness with political leaders, earth disturbances, weather, terrorism / cyber terrorism.

Dec 12 is the middle trine of a 3 pass which extends from July 17, 2013 to May 24, 2014. This signature has a history of significant cycles occurring somewhere between the first and last dates. At this point I would NOT be looking for a strong move up. Those who have studied Mundane Astrology understand astrological events are typically part of a cycle. The synodic cycle for the Jupiter waning trine to Saturn started at the last conjunction of these two planets. That is when the seed idea of this cycle was born. When was it? On May 22, 2000 just after the high in the dot com bubble and just before the meat of the slide down. This is en-grained in this synodic cycle. Don't think in isolation. Astrological aspects must be interpreted with an eye to the cycle they are in and the other cycles unfolding at the same time. We live in a big clock. This takes a lot of work and time. Most people don't put in the work and time.

Venus retrograde (+- a week) has a history of changes in monetary policy, interest rates, currencies and sometimes precious metals. Read that last sentence again. Venus retrograde can equate to counter trend moves in a number of markets. Every 8 years it retrogrades and returns direction in the same location of the zodiac. Venus turned retrograde within a couple of days of the 2009 bottom.

Uranus direct is associated with market trend changes (+- a week). It also has a history of trend changes in Gold within 2 days either way. Of possible more importance, Uranus turning direct usually marks an intermediate top or a bottom within a few weeks for the US$. See the blue arrow pointing right on the following chart. Normally I would give this signature a range of a couple of weeks either way. In this case the FOMC meeting starts on Dec 17 with the announcement and forecasts due out Dec 18. PAY ATTENTION TO THESE DATES AND ANNOUNCEMENTS. I hope I am clear. Also Quadruple Witching is on Dec 20, 2013, another day where large price swings are common.

The following weekly chart shows the 17 and 18 month cycles with the blue arrow Uranus turning direct.


Another chart for the SP500 showing resistance at the fib extension and another showing a Gann Fan with the 45 degree showing resistance.


I believe Gold is now in it's 7th week of the primary trend and overdue for a move up. It's possible we could see a spike low first but we should be close to a low which may occur around the Dec 17-21 dates or the end of the month when we have the translations of the Uranus / Pluto square. It would seem to tie into the Venus retrograde on Dec 21 and just 4 days after Uranus turns direct. These two planets could cause movement in a number of markets around the Dec 21 time frame.

In December and continuing into 2014 should see social unrest as pressure is mounting world-wide on changes to the structure of government and large institutions. People are increasingly unhappy with their elected officials. This theme will be repeated through much of this decade along with wealth disparity, increases in earth disturbances, severe weather, terrorism / cyber terrorism. What fun!

Things are expected to clear up economically and in other areas in 2020 or beyond. Hang on, it will be quite a ride.

This week or next I will I'll post a list of dates for the first half of 2014. These dates should cover market turns and important world events.

A note on Crude. Crude should be close to a bottom. It's in the 16th week of it's primary cycle. If it spikes low early in the week I'll be a buyer.

“You are who you are when no one is watching.”


Sunday, November 24, 2013

Financial Astrology - November 24, 2013

SP500
Anyone feeling a little wobbly, this weekend we had the long term heliocentric Uranus Pluto waxing square. Uranus is sudden events and the Iran nuclear deal is certainly that.

If there are Astrologers out there I'm looking at a chart for Iran based on Feb 1, 1979 at 9:30am in Tehran. I use Uranian points and mid-point analysis. I believe this was not the time for such an agreement. I hope this wasn't the U.S. Democrats coming up with an event to distract the public from on-going problems. Before I get emails on this statement, I do not live in the U.S. and not supporting Democrats or Republicans.

I believe we are in the 7th week of the primary cycle and due for a more substantial pullback. Although we did have a 3 day pullback I am expecting more. The difficulty is the FED's QE program. It is supporting the index with false valuations. The FED's economists don't live in the real world and unfortunately, by their actions, are manipulating the market.

Remember the definition of an economist.
"An economist can tell you 100 ways to make love to a woman. But he doesn't know any women".  Before I get emails please reverse for female economists. We'll need to keep our sense of humor over the next couple of years.

Nov 24 we have the Sun in waning square to Neptune. This signature has a history of market turns given a week either side. Neptune is the planet of illusion and delusion and is powerful in it's own sign. On the positive side the Sun just entered Sagittarius which is most often positive for the markets and the days around Thanksgiving in the U.S. also have a positive history.

Nevertheless, all things considered I'm expecting a pullback. We are at a 27/54 week cycle (green line on the following weekly chart) and Nov 28 has geocentric Venus opposing Jupiter very close to the heliocentric North Node of Pluto. A disruptive signature.

The 27 week cycle was on the Nov 17th post. 27 is an interesting number. The moon takes 27 days to revolve around the earth and then approx. 2 1/2 days more to catch up to the earth's movement. The Sun takes 27 days to rotate once at the equator. 27 * 4 = 108 an ancient Indian number.


I would wait for a move below 1,770 as seen on the following Fibonacci expansions chart before considering a short.


Gold
On Gold, the Sun in waning square to Neptune on Nov 24th, also has a history of trend changes in Gold but within a few days. We are in the 6th week of the Primary cycle so a trough could be forming for the 6th week cycle low (major cycle).

If we get a move up it will probably be short as the longer term cycles are pointing to late December or early 2014 for a larger low. Watch the 1233 area for support now.


Crude
Although due for a move up I'm waiting to see what effect the Iran nuclear deal will have on the price of crude. If sanctions effecting crude are lifted prices could drop significantly.


Saturday, November 23, 2013

Bradley Indicator 2014

Following is a daily chart showing 3 versions of the Bradley indicator. If you are don't know what the Bradley indicator is use Google or Bing.

From my own work I find it inconsistent but sometimes works. Therefore use it as a possible confirmation of a turn where you have other tools (cycles etc.) anticipating a change in trend.

The indicator does NOT show market direction. It's intent is to show when the market trend changes.

Red - the original Bradley

Green - Shramenko updated Bradley

Blue - Heliocentric Bradley.


Monday, November 18, 2013

Longer Term Update

One of the reasons I was looking for a move down in this time frame was the heliocentric opposition between Jupiter and Pluto.

The following is taken from the July 21 , 2013 post with an updated chart.

"A longer term look at some heliocentric transits. This monthly chart of the DJIA shows a longer term look at heliocentric aspects between Jupiter and Pluto. This shows every third conjunct between Jupiter and Pluto (small red circle is the conjunction, every third occurrence has a light blue circle) is near a crest and then moves down quickly. Also of interest is that every third opposition is close to a strong move down, either just before or just after the third opposition (double red arrow with light blue circle). This could be just before or just after the opposition. The next opposition is Nov 13. Note this is a monthly chart and with these slow moving aspects this could be due at any time."


So the exact date has passed but we are still in the time frame when a pullback could occur.

PS Yellin says the stock market is not in a bubble. She is obviously not stupid, therefore another liar.


Sunday, November 17, 2013

Financial Astrology - November 17, 2013

SP500
I continue to look for a pullback probably but not as far as originally predicted. The market is soaring on the continued FED monetary policy. As far as the FED is concerned watch what they do not what they say. They are taking money from the poor and middle class. The beneficiaries are the  banks. Just look at the last decade. FED monetary policy has been the source of the boom and bust stock market. Another bust is ahead of us. We are in the biggest financial market intervention in history. It's all fiat currency as Gold languishes due to flagrant manipulation. Where is the mainstream financial press. Useless, as they were in 2007 / 2008.

Following is a weekly chart for the SP500 showing the wild swings created by the FEDs monetary policy.


In the middle of such melt ups it will be difficult to call the turn. I'll try and call the approximate dates when we should get pullbacks.

There is a 27 week cycle coming up. Due the week of Nov 25 it could hit this week or the first week in December. Following is a weekly chart of the SP500 showing this cycle (blue and green vertical lines.


This coming week we have Chiron turning direct on Nov 19, the Sun entering Sagittarius on Nov 21 and Mercury transiting over the point of the November 3rd Solar eclipse. I'll add the Sun square Neptune of Nov 24. This often marks turns in many markets particularly equities and Gold. This is the waning trine.

I think we get a turn down in the 1st 3 days of the week.

Don't discount the Sun changing signs. On the following daily chart of the DJIA the red circles are the dates the Sun has changed signs and the light blue circles show when the Sun enters cardinal signs (change of seasons). The latter often being stronger turns.


Something more troubling are heliocentric aspects between Uranus / Pluto and Jupiter. They are forming a heliocentric T-square. I've seen many instances in the past where heliocentric outer aspects can result in stress on the earthly plain.

In addition heliocentric Pluto is quite close to the heliocentric South Node of Jupiter and heliocentric Jupiter is close to the heliocentric North Node of Jupiter.

These could be earthquakes, volcanic eruptions, bad storms or some other surprise disaster including financial disasters. Look to the period from Nov 20 to Nov 28th for an event(s). Unfortunately  I don't know where on the planet and the period could pass with no problems.

Gold
Watch Gold closely early in the week. We are either in the 21st week of the primary cycle (nominal 18 week) or the 5th week of a new primary. Alone this would tell us nothing as it could go up or down. Looking at the dma the 15 dma just crossed below the 45 dma which will be bearish if it does not reverse quickly. A daily close below 1,280/GCZ or worse 1,234/GCZ would be quite bearish.

The price action early in the week should be telling. Silver is pointing to at least a short term move up. I'm watching to see if Gold follows. Bear in mind the precious metals are more easily manipulated than other markets due to their small relative size.


There is another astrological signature which is pointing to a short move up ( a few days) then down possibly to year end or into January 2014.

Crude
I've been looking for a high in Crude around the first week in Jan 2014. This is at the meeting of the 16 and 24 week cycles (blue & red = green). This should mean a crest.


We need to see the 15 dma start to move up and the price rise over the 15 dma. The Sun waning square to Neptune on Nov 24 would be a good signature for a reversal in crude. Remember all dates are +- 3 td's unless otherwise noted.

Natural Gas

NatGas may have put in a bottom at the 56 cd cycle bottom on Nov 1. Note on the following chart of the NatGas ETF this was also the momentum bottom. Price is now over the 15 dma. We need to see the 15dma start moving up.


Sunday, November 10, 2013

Financial Astrology - November 10, 2013

First and foremost we should send a prayer to the souls lost in the Philippines and those under duress in the aftermath of the storm.

SP500
There are a number of long term transits occurring now and the next few years. Some of these are associated with natural disasters. Bear in mind China stopping the purchase of US bonds or the US$ losing it's status as the worlds reserve currency would be disasters. Also keep in mind the FED's QE program carries on which is supporting the market potentially creating the biggest bubble yet.

Just briefly off topic. I have become more convinced earthquake, volcanic eruptions and severe weather events are linked to the activity of the Sun, (sunspots, CME's and x-ray) events. These in turn are triggered by astrological aspects, mainly heliocentric aspects. This is a large area of study and more work needs to be done.

The Philippine disaster may effect a number of economic areas in the short term, for example technology companies with plants in the area. JIT inventory does not perform well in disaster situations. If money is made on trading disaster news consider sending 1/2 or some part to the relief effort.

Bear in mind the dates from the last post should still be valid.

Nov 13-15
Nov 21-22

Heliocentrically there are some heavy transits which may generate more surprises for the next 2 weeks.

I'll keep this chart from a few posts ago to monitor how we progress.


Without repeating previous posts I had been looking for a move down. With Fridays move up and the unfolding disaster we may see a bounce but I continue to look for a move lower particularly from Nov 13 on. Venus will be translating the Uranus / Pluto square on Nov 14/15, the latter date is OPEX. I had originally thought we'd be going down into Nov 22 where we have Mercury passing over the point of the Nov 3 eclipse.

Gold
Gold continues to head down. I'm looking for possible support at the fib levels on the next chart.

The low on Oct 15, 2013 is a critical as is the low on June 28 which I currently have as the 4.25 low.


Short term we may see a short up move early this week. See the following daily chart and the Sun Jupiter aspect falling on Monday.


Crude
Crude looks like it has put in a low or is very close. Neptune, which rules crude is in Pisces and is going direct on Nov 13th.


Watch Coffee as Neptune, which rules coffee, turns direct on Nov 13

Wednesday, November 6, 2013

Financial Astrology - Update Nov 6, 2013

I should have included Nov 7 as a potential turn in the Nov. 3rd post. Bear in mind next week has multiple signatures for a turn.

Nov 7 has Jupiter turning retrograde which can be a turn signal by itself. In this case Jupiter is almost exactly on the heliocentric North Node of Pluto. The planetary nodes are one of the few heliocentric events that can be used on geocentric charts.

Jupiter is co-ruler of crude and natural gas.

Sunday, November 3, 2013

Financial Astrology - Nov 3, 2013

SP500
Bear in mind we could see some unforeseen event over the next few weeks that could change this outlook and possibly effect the world on a broader basis.

On the markets, the time period we've been referring to since the June 16 post has arrived.
It should be volatile in many markets with one or two pullbacks. The SP500 could go up some more early in the week then down. This is not the big crash.

The US$ appears to have put in a 40 week trough which may not be good for Gold and Crude in the short run.

The days the market could move, and probably down. These dates include SP500 and Gold.

Nov 6
Nov 11
Nov 13-15
Nov 21-22

The following daily chart of the SP500 shows Fibonacci extensions and it just hit 138.2% and appears to have met resistance. The fib's are from point A to point B then taken off of C.


The SP500 also hit the Neptune price line (grey) 


And from a few posts back, the index went higher than forecast. We'll now see if the timing was correct.


Gold
Gold looks like it's breaking down. It's 1st retest is in the 1,250 area then the low on June 28 at the 1,179 area. Cycle wise Gold may be going down into the end of the year if it gets started here with the US buck on the rise.


US$
The last red square should be the 40 week low.


Crude
Also looking for a low. Key dates are:
Nov 7
Nov 13-15


Sunday, October 27, 2013

Financial Astrology - October 27, 2013

An overall message. Be very careful over the next few weeks.
SP500
We are at the time frame originally reported in the June 16th post, that being the late Oct / early Nov period. You may wish to note the next time period mentioned in that June 16 post is around April 21, 2014.

Recent price action is making short term forecasting somewhat difficult. The Uranus / Pluto square on Nov 1 and the Solar eclipse on Nov 3 are powerful astrological events but are more geared to longer term forecast. The following will identify specific dates but don't get too tied up in the short term dates. The Uranus/Pluto square and Solar eclipse are longer term transits but can be set off when transited by other bodies and points.

The Primary cycle action for the areas we cover, that is the SP500, Gold and Crude are as follows.

Primary Cycle (nominal 18 week)
SP500              18th week or 3rd week and there was a primary trough on Oct 9th

Gold                18th week or 2nd week and there was a primary trough on Oct 15th

Crude              11th week and we may be at 1/2 cycle low

The above are suggesting these markets are pointing up. This may be true or they are moving up in anticipation of the FOMC meeting this week. Is QE extended or even increased?

This is the opposite of what we have been expecting from an Astrological perspective. Following is what we see.

Oct 29 - Mercury conjunct Saturn.
Mercury just turned retrograde. The previous Mercury Saturn conjunction was on Oct 8 and was on the point of the Nov 3rd Solar eclipse (as noted in our Oct 6 post). The SP500 has shot up since that date.
The Mercury / Saturn conjunction on Oct 29 is not as close to the Nov 3rd Solar eclipse, but it's  close. This time Mercury is retrograde (moving backwards). Do we get a reversal here? Quite possibly.
For the SP500 Oct 29 is 55 trading days from the June 24 low. 55 is a Fibonacci number where we often see market turns.

Oct 30 - Sun conjunct the North Node
The last time the Sun was conjunct the North Node was Nov 16, 2012. This was a major low from which the SP500 has gone up. Does this mark the end of the move? Quite possibly.

Oct 30 - There are a number of declination parallels involving the Sun, Saturn, the North Node and Mercury starting Oct 30 through to Nov 3. This number of parallels often mark turning points.

Nov 1 - The often mentioned Uranus / Pluto waxing square, covered in a number of previous posts. This can effect the markets and many other areas of life. It's a long term transit with 7 exact hits, this being the 4th of 7. The next is April 2014. Look at this transit as being a key to upsets in government (not just the US), social unrest and changes for those in power.

Nov 3  Solar eclipse
Please see previous posts. This Solar eclipse is at 11 Scorpio 15 close to Saturn. Saturn is still in  mutual reception with Pluto making them both more powerful. Saturn and Pluto can be  2 of the more troubling planets in the horoscope, Saturn being the status quo, time and things that remain the same and also public sorrow, while Pluto denotes change by breaking down existing structures and regeneration. It's change that won't be undone. Pluto also represents great wealth and power and the tasks of bringing hidden information to light.
Being in Scorpio this eclipse could involve other peoples money, pensions and taxes.
Watch closely over the next few weeks. We may not have long to wait for this to manifest.
This eclipse is also in a loose quincunx to Uranus. A quincunx is 150 degree aspect that denotes no common ground. The eclipse is Scorpio, a fixed water sign while Uranus is in Aries a cardinal fire sign. Fire and water can bring things to a boiling point.

I could go on here, let me say I'm looking for a change in trend around this date.

Nov 4  Gold Fibonacci 89 trading days from the June 28 lows. Often markets turns +- a week at least.

Finally, is the SP500 forming a wolfe wave. See the following daily chart of the SP500. This would have been more symmetric if 5 had been at the Sept 19th crest. Nevertheless the SP500 has just broken through the rising diagonal (light blue lines). If we now fall below the upper line of the rising diagonal it would signal a good shorting oppourtunity. The red lines depict where we could fall in time and price if this is a valid wolfe wave. That is Dec 23 around $1,555 SP500. Hard to believe if QE continues.


Gold
I've noted a number of items that could effect short term changes in Gold above. Probably the most important is the direction of the US$ which has been down. There is a recurring 40-42 week cycle trough in the US$ which we are now hitting. A move up in the US buck has historically meant Gold is headed down. I say historically since things just aren't happening normally with the QE program and other financial shenanigans.

I'm still looking at June 28 being the 4.25 year cycle low for Gold. This will be confirmed if we break above the August highs. In the mean time there would  / should be a pull back if the US$ reacts to the 40-42 week cycle. Look for this in the month of November. A reversal in Gold could occur around the Nov 1, 4 dates above or a little later in November where we have many significant heliocentric (sun centered) aspects and multiple planets changing direction (see the last post for dates).

Also watch Nov 11 for a swing in Gold.

Daily chart of Gold


Weekly chart of US$


Crude
Crude is meandering lower but just hit a hammer doji on Oct 24 and hit the 61.8% retracement of the move up from April 18 to August 28. Looking back a few months this area may serve as support. This is approx. at the 1/2 primary cycle where we often find turns. This area needs to be watched particularly around the critical dates defined above Nov 1,4 +- a week.