Sunday, March 25, 2012

Gold and Silver March 23, 2012


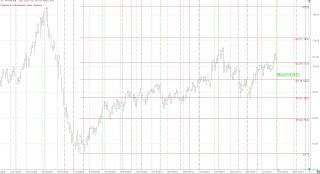
The following two daily charts show Gold then Silver and the heliocentric Venus (green) Jupiter (blue) price lines. Notice the previous instances where these lines cross often coincides with a sharp move in the precious metals. Could be up or down. I'm looking for a move up. Keep in mind, the move usually happens near the crossing of the heliocentric Venus and Jupiter lines not necessarily on the specific day. There are other aspects this week which could effect precious metals. Two are Saturn quintile Pluto and the Sun squared Pluto.

This assumes we have just put in a higher low. Gold has been putting in lower highs since the high in September 2011. To change the longer term trend to up Gold needs to start putting in higher highs. A good start would be to break through the 200 day moving average currently near 1680.


Gold


Silver

The third daily chart of Gold shows the 144 trading day (blue) and the 89 calendar day (red) cycles are both hitting in this time frame. This is pointing to a move up in precious metals.


Gold

Looking out longer term the US dollar has a consistent 17-18 month cycle which is due to bottom in the October 2012 +- time frame. A weaker dollar results in a strong Gold price as it takes more dollars to buy the same amount of Gold. Following is a weekly chart of the US dollar. The vertical blue and red lines are the 17 and 18 month cycles respectively.

US$

Monday, March 19, 2012

March 19, 2012 Update

SP500

The SP500 and all US indexes keep chugging higher. This week has a number of potential turn signals. Tomorrow March 20 is the spring equinox. Sun enters Aries and approaches Uranus and will be conjunct on the weekend.

March 22 is a new Moon which can be a turn signal by itself. This one is within 2 degrees of volatile Uranus. The following daily chart shows March 22 as the next 39 trading day (td) cycle (+- 2 tds). Note, previous instances have marked bottoms, sometimes s/t tops and sometimes nothing.


Gold
As stated above, tomorrow, March 20 is the spring equinox and is 55 td from the low in Gold and Silver on Dec 29, 2011. Price action appears to be turning up although more confirmation is required.


Crude
Although more downside action was expected crude appears to be turning up. More confirmation is required.


Tuesday, March 13, 2012

Quantitative Easing

The following chart shows the effect of quantitative easing. Any news of QE 3 just buy.


courtesy of
http://www.traders-talk.com/mb2/index.php?s=446440937fcaf7624fc29471ae2da6ce&showtopic=138457
and 
http://www.timeandcycles.com/

Sunday, March 11, 2012

Grand Trine in Earth - Week of March 12, 2012


SP500
So, we have arrived at the week of the large grand trine in earth. I’ve been pondering over this timeframe for quite some time. In Astrology trines are generally construed as positive. This one takes pace in earth signs between (Jupiter + Venus), Mars and Pluto. Jupiter and Venus are conjunct, another positive and Venus is in it’s rulership, another positive. Venus and Jupiter are the two money planets in a horoscope. Nevertheless I think we are going down, stocks that is. We may get one last pop on March 12. If the FED announces or hints at a QE 3 program then all bets are off. Just buy and sit on your hands.

I’ll be watching the following chart closely. This chart shows the fib retracements from point A to point B and then moves them up to start at C. So far this marked the top. If the SP breaks the 1376 area on strong volume we may have to re-visit this call. This may be a double top. 78.6% or 1330 retracements can be strong support. .786 is the square root of .618. If the SP500 breaks the 1330 area the other fib retracements shown may be good support areas.


Why do I think the stock markets will be going down? I’m not looking for a crash just a corrective pullback of 3%-5%. Jupiter aspects can mark periods of time when things are overdone. On Monday evening March 12 Mercury turns retrograde. Also Monday evening the Uranian point, Hades turns direct while it is very close to the powerful Capricorn / Cancer axis and it is almost on the antiscia point for the May 20, 2012. The period around May 20, 2012 maybe a timeframe to remember. In addition both heliocentric Mercury and Venus will be changing signs and both will be aspecting Neptune in the early part of Pisces.

The middle / third cycle of heliocentric Mercury often marks a short term pull back in the markets. This is not necessarily to the day.


We also have the North Node squaring Mars and quincunx Jupiter. March 13 is 110 td's (fib 55td's * 2) from the Oct4, 2011 lows.

In short we are looking for a possible high on Monday March 12 and then a move lower. We do not want to see the SP go much higher then the 1376 - 1380 area. This is a tough call based on Astros alone.

Following is a list of Astro based critical days for 2012. As we progress I may be adding or deleting dates.As always allow +- 3 days.

Feb 27
March 5, 6
March 8           .
March 13
April 12
May 20
June 6
June 25
August 15
November 23

Crude.
I thought we would have a bigger move down in crude based on the 16 and 24 week cycles. We may still see it this coming week.


Gold and Silver
I'm looking for Gold and Silver to move lower into either the spring equinox or month end. Like stocks they could have a surge on Monday.

Friday, March 9, 2012

Earthquake - Just to keep the record straight

Since the main stream media does such poor and distorted coverage of what's going on in the world.

http://www.lasvegassun.com/news/2012/mar/09/as-vanuatu-earthquake/

I continue to believe in a connection of CME's which produce geomagnetic storms around New and Full moons (particularly perigee moons) and geophysical activity (i.e. earthquakes and volcanoes).

March 9 Note

Watch the SP500. If it breaks the high on Monday March 5 or the February high for 1 to 2 hours be very careful. If it breaks those highs and quickly retreats I'll be looking for short oppourtunities.

March 13 is 110 trading days from the Oct 4, 2011 low. 110 / 2 = 55 trading days a fib number.

Monday, March 5, 2012

Full Moon March 8

Please look at the dates given on the February 20th post. The X1.1 solar flare is expected to generate a mild geomagnetic storm with arrival time March 7-8.

Geomagnetic storms around Full Moons can result in earthquakes. Watch for issues March 7through the 10th. Nuff said.


STRONG SOLAR ACTIVITY: Big sunspot AR1429

Big sunspot AR1429, which emerged over the weekend, is crackling with strong flares. This morning the active region produced an X1-class eruption and a bright coronal mass ejection (CME). The CME appears set to deliver a glancing blow to Earth's magnetic field in the days ahead, possibly sparking geomagnetic storms. Stay tuned to http://spaceweather.com for images and updates.

Sunday, March 4, 2012

My Big Fat Greek Restructuring - The Week Ahead

From ZeroHedge

http://www.zerohedge.com/news/my-big-fat-greek-restructuring-week-ahead

There are a lot of transits hitting this month. I'm expecting volatility. Review our older posts.

March 5,6 SP500 turn.
March 5-9 Crude 16 and 24 week cycles. This could be a s/t peak.
March 13 Many markets...grand trine. Will this mark a top and a dramatic turn down or will we be down and this aspect drives the market up?

Should be fun !!!

Thursday, March 1, 2012

SPX Venus Saturn / 22 week

The attached daily chart shows the SP with the recent Venus Saturn aspects.

April 30, 2011 Venus opposition Saturn

Sept 29, 2011 Venus conjunct Saturn

Mar 4, 2012 Venus opposition Saturn.

The 22 and 44 week cycles should be self-explanatory.

There is also an aspect on March 3rd, Sun opposition Mars, which has a good history of occurring near market turns.

Should be headed down next week. What will the Central Banks of the world do with all that money?


March 1, 2012

Watch out for some possible news exposing lies or deceit over the next 3 days.