Friday, July 26, 2019

Financial Astrology - July 29, 2019 (Short Version)


Our posts are now reported on the highly regarded FXStreet.com.


Summary

We are entering the summer period where interest and action in the markets and financials in general usually dissipates somewhat. We will continue with the weekly blog posts but the posts will be shorter than usual with a couple of weekends off. I will get back to normal posts in late August.

The financial world awaits the interest rate decision by the FOMC this coming week This should keep Gold up and it is quite possible the rising Primary cycle may hit the ½ Primary cycle or
9-week cycle and reverse.

Both of the above comments have to do with the Sun square Uranus aspect on July 29th.

Another pertinent aspect is Mercury turning direct on July 31, the day of the FOMC decision. Mercury turning direct often signifies a change in trend for the financial markets. The veil of confusion that follows Mercury retrograde gets a clearer path forward.

Volatility of world events continues with Iran lining up against the US and the UK.
There will be a number of aspects involving Venus From July 16 through the end of the month. Among other things aspects to Venus may involve a countries currency. This may drive up crude and increase the price of precious metals.

We may get another war but I'm looking at September 9, 2020 and beyond for a major war effort. That day Mars turns retrograde while squaring the conjunction of Saturn / Pluto.

SP500
We are entering the 8th week of a new Primary cycle which started on June 3, 2019. In the current situation I am looking for a crest of the 9 week cycle.

The potent Sun/ Mars conjunction will be in orb from now until the end of September. This conjunction has a record of stock market reversals.

Following is an up to date chart of the SP500.


Jupiter square Neptune which we have mentioned numerous times may be the real problem as these planets in aspect can be quite inflationary. This may be pointing to serious financial problems late 2019 or early on 2020.

The Jupiter / Neptune square is still in scope and the effects are still being felt. The final Jupiter / Neptune square will be Sept 21 but it will be in orb much longer. The Saturn / Pluto conjunction is also still in orb. Both will come back to exact conjunction.

If the SP500 index has not moved much by August 9 watch the following week where we have Uranus going retrograde and Jupiter direct both on August 11. This indicates a strong change in trend. When I mention a day it is always a minimum +- 3 tds (trading days) and sometimes much longer.

The following weekly chart of the SP500 shows:
Purple square - Sun square Uranus - July 29
Orange Circle - Sun trine Jupiter  - Aug 7
Purple arrow pointed left - Uranus Retrograde - Aug 11
Orange arrow pointed right - Jupiter Direct - Aug 11

The vertical black lines are a 66 week cycle.


Gold

Gold is in the 9th week of the new 18 week Primary cycle. This could be the 9 week cycle trough or ½ Primary cycle trough.

The Sun waxing square Uranus can indicate a forming trough often 5 tds after the exact square. This exact square is on July 29, 2019.


Crude's 

We had the Primary Cycle trough for crude oil on June 5th and are entering the 7th week of a new Primary cycle.
This needs more confirmation. Crude may be quite volatile over the summer months and into the late summer (i.e. Sept 21, 2019). Obviously, the price of crude will go up if relations with Iran worsen. I’m expecting a rise in crude oil price by the fall time frame.


Monday, July 22, 2019

Financial Astrology - July 22 additional chart.


Our posts are now reported on the highly regarded FXStreet.com.


Summary

We are entering the summer period where interest and action in the markets and financials in general usually dissipates somewhat. We will continue with the weekly blog posts but the posts will be shorter than usual with a couple of weekends off. I will get back to normal posts in late August.

The financial world awaits the interest rate decision by the FOMC this coming week This should keep Gold up and it is quite possible the rising Primary cycle may hit the ½ Primary cycle or
9-week cycle and reverse.

Both of the above comments have to do with the Sun square Uranus aspect on July 29th.

Another pertinent aspect is Mercury turning direct on July 31, the day of the FOMC decision. Mercury turning direct often signifies a change in trend for the financial markets. The veil of confusion that follows Mercury retrograde gets a clearer path forward.

Volatility of world events continues with Iran lining up against the US and the UK.
There will be a number of aspects involving Venus From July 16 through the end of the month. Among other things aspects to Venus may involve a countries currency. This may drive up crude and increase the price of precious metals.

We may get another war but I'm looking at September 9, 2020 and beyond for a major war effort. That day Mars turns retrograde while squaring the conjunction of Saturn / Pluto.

SP500
We are entering the 8th week of a new Primary cycle which started on June 3, 2019. In the current situation I am looking for a crest of the 9 week cycle.

The potent Sun/ Mars conjunction will be in orb from now until the end of September. This conjunction has a record of stock market reversals.

Following is an up to dare chart of the SP500.


Jupiter square Neptune which we have mentioned numerous times may be the real problem as these planets in aspect can be quite inflationary. This may be pointing to serious financial problems late 2019 or early on 2020.

The Jupiter / Neptune square is still in scope and the effects are still being felt. The Saturn / Pluto conjunction is also still in orb. Both will come back to exact conjunction.

If the SP500 index has not moved much by August 9 watch the following week where we have Uranus going retrograde and Jupiter direct both on August 11. This indicates a strong change in trend. When I mention a day it is always a minimum +- 3 tds (trading days) and sometimes much longer.

Gold

Gold is in the 9th week of the new 18 week Primary cycle. This could be the 9 week cycle trough or ½ Primary cycle trough.

The Sun waxing square Uranus can indicate a forming trough often 5 tds after the exact square. This exact square is on July 29, 2019.


Crude's 

We had the Primary Cycle trough for crude oil on June 5th and are entering the 7th week of a new Primary cycle.
This needs more confirmation. Crude may be quite volatile over the summer months and into the late summer (i.e. Sept 21, 2019). Obviously, the price of crude will go up if relations with Iran worsen. I’m expecting a rise in crude oil price by the fall time frame.


Saturday, July 20, 2019

Financial Astrology - July 22, 2019


Our posts are now reported on the highly regarded FXStreet.com.

Summary

We are entering the summer period where interest and action in the markets and financials in general usually dissipates somewhat. We will continue with the weekly blog posts but the posts will be shorter than usual with a couple of weekends off. I will get back to a normal post in late August. Also, I cancelled the comments section due to foul language.

The biggest astrological event was the Solar eclipse and the aspects around it, on July 2, 2019. Solar eclipses often coincide with significant earthquakes. In this case there were significant earthquakes in California and west coast of Canada. The following dates are all +- 3 td’s.

July 15            Saturn parallel Pluto
                        If the planets are both North or both South of the ecliptic, the parallel aspect is                          read as a conjunction. If they are the same declination but one is North and one                                    is South, then the contra-parallel is read as a 180 degree opposition.

Saturn is the planet of security, protectionism, tradition, convention, conservative (rear vision) thinking, economy, cost cutting, lower prices, business slowdowns, recession, poverty, farmers, mining, coal, the weather, storms, floods, droughts, disease, fear, suffering and me-first.

Pluto is the planet of drastic situations, cooperation, coercion, groups, gangs, crowds, mobs, human rights groups, human welfare workers, dictators, criminals, crime networks, insidious crimes, subtle cunning, inversion and misinformation.
Volatility of world events continues with Iran lining up against the US and the UK.
There will be a number of aspects involving Venus From July 16 through the end of the month. Among other things aspects to Venus may involve a countries currency. This may drive up crude and increase the price of precious metals.

Following is the Sagittarius Rising astrological chart for the U.S. There are a number of charts.In the third house we have transiting Neptune conjunct the Uranian point Vulcanus  Very explosive. When we look for changes in trend we find Mercury turning Direct on July 31. This should indicate a change in trend centered around the Mercury date. +- 3 tds. Mercury will turn direct in Cancer, a cardinal Water sign. Mercury turning direct will arrive July 31 the same date as the FED rate decision.


Neptune is about spirituality, weakness, illusion, healing, hospitals and medical care. Legal and illegal drugs, chemicals, poisons, scandal, corruption, fraud and confusion. Film glamour, photography, left-wing politics, socialism, communism, the oceans, oil and gas, and prisons and hidden things.

Vulcanus rules great power and potential. Mars - Vulcanus rules great aggression. In the nineties there was a computer networking boom. With Neptune we may see an increase of war like activity. Vulcanus is a Uranian point.

We may get another war but I'm looking at September 9, 2020 and beyond for a major war effort. That day Mars turns retrograde while squaring the conjunction of Saturn / Pluto.

SP500
We are entering the 7th week of a new Primary cycle which started on June 3, 2019. In the current situation I am looking for a crest of the 6 week cycle and then a move down to the either the 6 week or 9 week cycle trough. It appears the move down to a trough has begun.

If the SP500 has not started down by July 22 I will sit and watch for awhile

The Sun will change signs into Leo on July 22 which often triggers a change in trend.

Jupiter square Neptune which we have mentioned numerous times may be the real problem as these planets in aspect can be quite inflationary. This may be pointing to serious financial problems late 2019 or early on 2020.

The Jupiter / Neptune square is still in scope and the effects are still being felt. The Saturn / Pluto conjunction is also still in orb. Both will come back to exact conjunction.

Gold

Gold is in the 7th week of the new 18 week Primary cycle. This would be another reason for Gold to go down here and is past due for a 6 week cycle although it could have put in a trough around July 3rd. This could go to a 9 week cycle trough (approx., 2 weeks).
The Sun waxing square Uranus can indicate a forming trough often 5 tds after the exact square.This exact square is on July 29, 2019. 

Crude's Crude started up on Dec 24, 2018. We are entering the 7th week of the Primary cycle.

We may have had the Primary Cycle trough for crude oil on June 5. This needs more confirmation. Crude may be quite volatile over the summer months and into the late summer (i.e. Sept 21, 2019).
Obviously the price of crude will go up if relations with Iran worsen..

SP500
We are currently entering a new Primary cycle starting on June 3, 2019. We are 7 weeks along.  

I’m looking at this as a Primary cycle trough and going up in a new Primary. The new Primary started on June 3 and we are 7 weeks along. Remember the Jupiter square Neptune where lies are covered up and general untruths are spoken. It is still in orb.
The Primary cycle is approx.18 weeks and is typically composed of 3- 6 week sub-cycles or 2-9 week sub-cycles or a combo of both.

The 15 day sma is red, the 45 day sma is blue and the light blue is the 200 day sma. Note; the normal Fibonacci retracement levels are 23.6%, 38.2%, 50.0 %, and 61.8%.

One can also use extended retracements which typically use the square roots of one of the above. So, I also use SqrRoot(61.8) = 78.6  and SqrRoot(78.6) = 88.6.

The green vertical lines are a 27 CD (calendar day) cycle next due Aug 7, 2019.


The above daily chart shows upcoming medium term cycles at the bottom of the chart.

Light blue is the 40-week
Red is the 20-week
Light green 10-week
Brown is the 5 week

The coming week may be very volatile.

Whenever we get longer term aspects we should look at other planets in transit that may hit the longer term aspect.

When looking at any Astro analysis for 2019 we should remember the effect of Jupiter square Neptune and Saturn conjunct Pluto. These aspects will be with us all year and beyond.

All dates +- 3 td’s (trading days) at a minimum.

From the last few posts:
“This coming year could see an increase in geophysical activity, both earthquakes and volcanos. Late June through early July may see more geophysical activity.”

See the link under “Earthquakes”. This is an application from the USGS. Geophysical activity has been picking up.

We may be seeing a war develop but if so, I would expect war like activity in the fall.

Although we do not have enough data the 45 year cycle is pointing to Sept 2022 this could also be the 90 year cycle. We do not have enough data to make the 90 year call. For a 90 year cycle I’m looking at the years 1842 – 1932 and then 2022.

The following daily chart of the SP500 shows 2 Envelope channels. Red is the centered 
20 week envelope channel. Blue is the centered 40 week envelope channel.

The blue squares are the dates of the Mars square Uranus transit. Next up July 11, 2019.


The red averages are based on the 20 week so they are shifted 10 weeks or a ½ cycle. This is known as a centered moving average.

I brought up Iran on the last couple of posts. Iran may be active. Watch the period around July 13, 2019 and forward for problems with Iran. July 13 has transiting Hades conjunct natal Vulcanus  in Iran;s chart. If there is going to be a war I would look to the fall of 2019 or early 2020.

Watch for news from India and Pakistan as well.

The Bradley Indicator
This stock index forecasting tool was designed by astrologer Donald Bradley and published in 1947 in a booklet titled "Stock Market Prediction".
On the cover this tool is called the Planetary Barometer and inside the booklet it is called a Siderograph. Now it is simply called "the Bradley". The

Bradley is meant to forecast major and minor turning-points (where a trend will reverse) in either the Dow Jones Industrial Average or SP500 indexes. Bradley's work was obviously on the DJIA.

It does not forecast or anticipate whether that turning-point will be a high or a low. It has no polarity. The Bradley may turn up while the DJIA turns down. The amplitude of the Bradley swing is also not important. It only finds periods where trend changes occur.
It should be understood Astrologers in decades gone by who had no computers, spreadsheets, or databases to analyze data typically worked with much smaller data sets than we do today. This maybe why the Bradley worked so well when it first came out in 1947 but now is somewhat unreliable. Now, it goes through periods where it works fairly well but then can stop operating for months at a time. Originally it was for geocentric astrology (Earth centered) but there are now heliocentric models (Sun centered) and others.

In Bradley's own words:
"At no time must the reader gain the impression that a siderograph, as such, is a prediction of what the stock market will actually do. Nevertheless, observation proves that basic reversals in collective attitudes, clearly predicted by the line, are inevitably mirrored in stock averages"

So if the Bradley only identifies trend changes, what are trend changes?
- a rising market changes to a falling market
- a rising market changes to sideways
- a sideways market starts going up
- a sideways market starts going down
- a market going down changes to a rising market
- a falling market starts going sideways

The indicator is pointing to a change in trend for the SP500.


Gold

Gold found support at 1273, in fact it found support there 3 times. We have now moved up and Gold should be in the 7th week of a new Primary cycle which started on May 22. Like any new Primary cycle there may be a pullback in the 2nd or 3rd week. I’m also looking for the 7 week cycle trough although it could wait for the 9 week cycle trough.

I’ve had a bullish view but the US$ has to retreat. Bitcoin has been on the rise


The following chart shows two daily envelope channels. The vertical red lines are a 20 day cycle.


The following chart shows when Mars enters a new sign (red squares). It often affects Gold. Mars changes signs into Virgo.

Watch August 16, 2019 for a change in trend.
Watch for geophysical activity around this timeframe.


Crude

With the problems involving Iran and crude, transport prices may be going up.

I’m expecting crude to go up if problems persist between Iran and the US. Notice price broke through the 15 and 45 day sma headed down.

We need more confirmation of this being a new Primary cycle.

I am expecting crude and possibly marijuana stocks to be affected by the Jupiter / Neptune square.

Jupiter and Neptune are the co-rulers of Crude.

Beyond affecting crude these two planets have to do with illusions and delusions. Thus marijuana stocks.


This puts us entering week 7 of a new Primary cycle.

Following is a chart for crude with the 17 month crude cycle shown as the red vertical lines. The next 17 month cycle date is May 11, 2020


Saturday, July 13, 2019

Financial Astrology - July 15, 2019


Our posts are now reported on the highly regarded FXStreet.com.

Summary

We are entering the summer period where interest and action in the markets and financials in general usually dissipates somewhat. We will continue with the weekly blog posts but the posts will be shorter than usual with a couple of weekends off. I will get back to a normal post in late August.

The biggest astrological event was Solar eclipse and the aspects around it, on July 2, 2019. Solar eclipses often coincide with significant earthquakes. In this case there were significant earthquakes in California and west coast of Canada. The following dates are all +- 3 td’s.

July 14            Sun opposition Pluto
                        May be pointing to a change in trend for the SP500.

July 15            Saturn parallel Pluto
                        If the planets are both North or both South of the ecliptic, the parallel aspect is                         read as a conjunction. If they are the same declination but one is North and one                         is South, then the contra-parallel is read as a 180 degree opposition.

Saturn is the planet of security, protectionism, tradition, convention, conservative (rear vision) thinking, economy, cost cutting, lower prices, business slowdowns, recession, poverty, farmers, mining, coal, the weather, storms, floods, droughts, disease, fear, suffering and me-first.
Pluto is the planet of drastic situations, cooperation, coercion, groups, gangs, crowds, mobs, human rights groups, human welfare workers, dictators, criminals, crime networks, insidious crimes, subtle cunning, inversion and misinformation.
There will be a number of aspects involving Venus From July 16 through the end of the month. Among other things aspects to Venus may involve a countries currency.

SP500
We are entering the 6th week of a new Primary cycle which started on June 3, 2019. In the current situation I am looking for a crest of the 6 week cycle and then a move down to the either the 6 week or 9 week cycle trough.

I am also looking for the Sun opposition Pluto on July 14 and Saturn parallel Pluto on July 15 as the triggers. The Primary cycle is approx. 18 weeks. and can have 3-6 week sub cycles or 2-9 week cycles. Both of these aspects are +- 5 td’s (trading days). If the SP500 has not started down by July 22 I will sit and watch for awhile.

Jupiter square Neptune which we have mentioned numerous times may be the real problem as these planets in aspect can be quite inflationary. This may be pointing to serious financial problems late 2019 or early on 2020.

The Jupiter / Neptune square is still in scope and the effects are still being felt.


Gold I am now looking for Gold to trend down although this may not be immediate. The Sun opposition Pluto is often favorable for Gold.

Gold is in the 7th week of the new 18 week Primary cycle. This would be another reason for Gold to go down here and is past due for a 6 week cycle trough. This could go to a 9 week cycle trough.

Crude's Crude started up on Dec 24, 2018. We are either entering the 24th week of the Primary cycle or we started a new Primary cycle on June 5 and we are 6 weeks along..

We may have had the Primary Cycle trough for crude oil on June 5. This needs more confirmation. Crude may be quite volatile over the summer months and into the late summer (i.e. Sept 21, 2019).

SP500
We are currently entering a new Primary cycle starting on June 3, 2019. We are 6 weeks along.  

I’m looking at this as a Primary cycle trough and going up in a new Primary. The new Primary started on June 3 and we are 6 weeks along. Remember the Jupiter square Neptune where lies are covered up and general untruths are spoken. It is still in orb.
The Primary cycle is approx.18 weeks and is typically composed of 3- 6 week sub-cycles or 2-9 week sub-cycles or a combo of both.

The 15 day sma is red, the 45 day sma is blue and the light blue is the 200 day sma. Note; the normal Fibonacci retracement levels are 23.6%, 38.2%, 50.0 %, and 61.8%.

One can also use extended retracements which typically use the square roots of one of the above. So, I also use SqrRoot(61.8) = 78.6  and SqrRoot(78.6) = 88.6.

The green vertical lines are a 27 CD (calendar day) cycle next due July 11, 2019.


The above daily chart shows upcoming medium term cycles at the bottom of the chart.

Light blue is the 40-week
Red is the 20-week
Light green 10-week
Brown is the 5 week

Whenever we get longer term aspects we should look at other planets in transit that may hit the longer term aspect.

When looking at any Astro analysis for 2019 we should remember the effect of Jupiter square Neptune and Saturn conjunct Pluto. These aspects will be with us all year and beyond.

All dates +- 3 td’s (trading days) at a minimum.

From the last few posts:
“This coming year could see an increase in geophysical activity, both earthquakes and volcanos. Late June through early July may see more geophysical activity.”

See the link under “Earthquakes”. This is an application from the USGS. Geophysical activity has been picking up.

Although we do not have enough data the 45 year cycle is pointing to Sept 2022 this could also be the 90 year cycle. We do not have enough data to make the 90 year call. For a 90 year cycle I’m looking at the years 1842 – 1932 and then 2022.

The following daily chart of the SP500 shows 2 Envelope channels. Red is the centered 
20 week envelope channel. Blue is the centered 40 week envelope channel.

The blue squares are the dates of the Mars square Uranus transit. Next up July 11, 2019.


The red averages are based on the 20 week so they are shifted 10 weeks or a ½ cycle. This is known as a centered moving average.

I brought up Iran on the last couple of posts. Iran may be active. Watch the period around July 13, 2019 and forward for problems with Iran. July 13 has transiting Hades conjunct natal Vulcanus  in Iran;s chart. If there is going to be a war I would look to the fall of 2019 or early 2020.

Watch for news from India and Pakistan as well.

The Bradley Indicator
This stock index forecasting tool was designed by astrologer Donald Bradley and published in 1947 in a booklet titled "Stock Market Prediction".
On the cover this tool is called the Planetary Barometer and inside the booklet it is called a Siderograph. Now it is simply called "the Bradley". The

Bradley is meant to forecast major and minor turning-points (where a trend will reverse) in either the Dow Jones Industrial Average or SP500 indexes. Bradley's work was obviously on the DJIA.

It does not forecast or anticipate whether that turning-point will be a high or a low. It has no polarity. The Bradley may turn up while the DJIA turns down. The amplitude of the Bradley swing is also not important. It only finds periods where trend changes occur.
It should be understood Astrologers in decades gone by who had no computers, spreadsheets, or databases to analyze data typically worked with much smaller data sets than we do today. This maybe why the Bradley worked so well when it first came out in 1947 but now is somewhat unreliable. Now, it goes through periods where it works fairly well but then can stop operating for months at a time. Originally it was for geocentric astrology (Earth centered) but there are now heliocentric models (Sun centered) and others.

In Bradley's own words:
"At no time must the reader gain the impression that a siderograph, as such, is a prediction of what the stock market will actually do. Nevertheless, observation proves that basic reversals in collective attitudes, clearly predicted by the line, are inevitably mirrored in stock averages"

So if the Bradley only identifies trend changes, what are trend changes?
- a rising market changes to a falling market
- a rising market changes to sideways
- a sideways market starts going up
- a sideways market starts going down
- a market going down changes to a rising market
- a falling market starts going sideways

The indicator is pointing to a change in trend for the SP500.


Gold

Gold found support at 1273, in fact it found support there 3 times. We have now moved up and Gold should be in the 7th week of a new Primary cycle which started on May 22. Like any new Primary cycle there may be a pullback in the 2nd or 3rd week. I’m also looking for the 7 week cycle trough although it could wait for the 9 week cycle trough.

I’ve had a bullish view but the US$ has to retreat. Bitcoin has been on the rise


The following chart shows two daily envelope channels. The vertical red lines are a 20 day cycle.


The following chart shows when Mars enters a new sign (red squares). It often affects Gold. Mars changes signs into Virgo.

Watch August 16, 2019 for a change in trend.
Watch for geophysical activity around this timeframe.


Crude

With the problems involving Iran and crude, transport prices may be going up.

I’m expecting crude to go up if problems persist between Iran and the US. Notice price broke through the 15 and 45 day sma.

We need more confirmation of this being a new Primary cycle.

I am expecting crude and possibly marijuana stocks to be affected by the Jupiter / Neptune square.

Jupiter and Neptune are the co-rulers of Crude.

Beyond affecting crude these two planets have to do with illusions and delusions. Thus marijuana stocks.


This puts us entering week 24 of the old Primary cycle or we have just started a new Primary cycle on June 5 and we are in the 6th week.

Following is a chart for crude with the 17 month crude cycle shown as the red vertical lines. The next 17 month cycle date is May 11, 2020


Saturday, July 6, 2019

Financial Astrology - July 8, 2019


Our posts are now reported on the highly regarded FXStreet.com.


Summary

We are entering the summer period where interest and action in the markets and financials in general usually dissipates somewhat. We will continue with the weekly blog posts but the posts will be shorter than usual with a couple of weekends off.

The biggest astrological event was Solar eclipse and the aspects around it, on July 2, 2019. Solar eclipses often coincide with significant earthquakes. In this case there were significant earthquakes in California and west coast of Canada. The following dates are all +- 3 td’s.

July 2              Mars conjunct Vulcanos. Mars is masculine energy and can stand for conflict or                         war. Vulcanus rules great power and potential. It is a Uranian point (use google).
                       
July 4              Saturn conjunct the South Node. This stands for things from the past that                                  surface again and must be dealt with. This may not be pleasant. They are in                                 Capricorn and may deal with business or reputation.
                       
July 7              Mercury turns Retrograde. Don’t sign agreements. Watch for confusion and                             delusion in trading. Often get a change in trend when Mercury turns retrograde                             or Direct.

July 9              Sun opposition Saturn
                        More often a crest than a trough so it may be better to sell in preparation of a                         pullback.

July 11            Mars square Uranus
                        Sell when market is rising and this aspect is coming due.

                        Sun trine Neptune
                        Could be a crest or a trough but often has a significant effect on price of the                         SP500.

July 14            Sun opposition Pluto
                        May be pointing to a change in trend for the SP500.

July 15            Saturn parallel Pluto
                        If the planets are both North or both South of the ecliptic, the parallel                                      aspect is read as a conjunction. If they are the same declination but one is                            North and one is South, then the contra-parallel is read as a 180 degree                                opposition.

                     Saturn is the planet of security, protectionism, tradition, convention,                                         conservative (rear vision) thinking, economy, cost cutting, lower prices,                                   business slowdowns, recession, poverty, farmers, mining, coal, the weather,                           storms, floods, droughts, disease, fear, suffering and me-first.
                 Pluto is the planet of drastic situations, cooperation, coercion, groups,                             gangs, crowds, mobs, human rights groups, human welfare workers,                             dictators, criminals, crime networks, insidious crimes, subtle cunning,                             inversion and misinformation.
I look at the parallel as a weaker conjunction. These two planets are powerful. Their real power will be shown in late January 2020 when they are in conjunction.

There will be a number of aspects involving Venus From July 16 through the end of the month. Among other things aspects to Venus may involve a countries currency.

SP500
We are entering the 5th week of a new Primary cycle which started on June 3, 2019. Being in the 5th week look for the approx. 6 week cycle trough. The Primary cycle is approx. 18 weeks and can have 3-6 week sub cycles. This is approx. The 6 week cycle and the dates mentioned above should point to a 1 – 2 week sell-off in major stock indices.

The normal range for the Primary circle is 15 – 21 weeks which would be Sept 9 – Oct 28 2019. We may see increased volatility. Longer term I’m expecting bigger moves and changes from 2020 through 2023.

Jupiter square Neptune which we have mentioned numerous times may be the real problem as these planets in aspect can be quite inflationary. This may be pointing to serious financial problems late 2019 or early on 2020.

This square was exact on Jan 13, 2019 and June 16, 2019 then Sept 21, 2019. Will this square continue to be a delusion / illusion? Around the Sept 21 date we may see reality rather than the illusions that has been seen from the Jupiter / Neptune square.

I’m watching moves in the SP500 closely. A move above 2952 would be bullish. I’m still  looking for the SP500 to roll over.

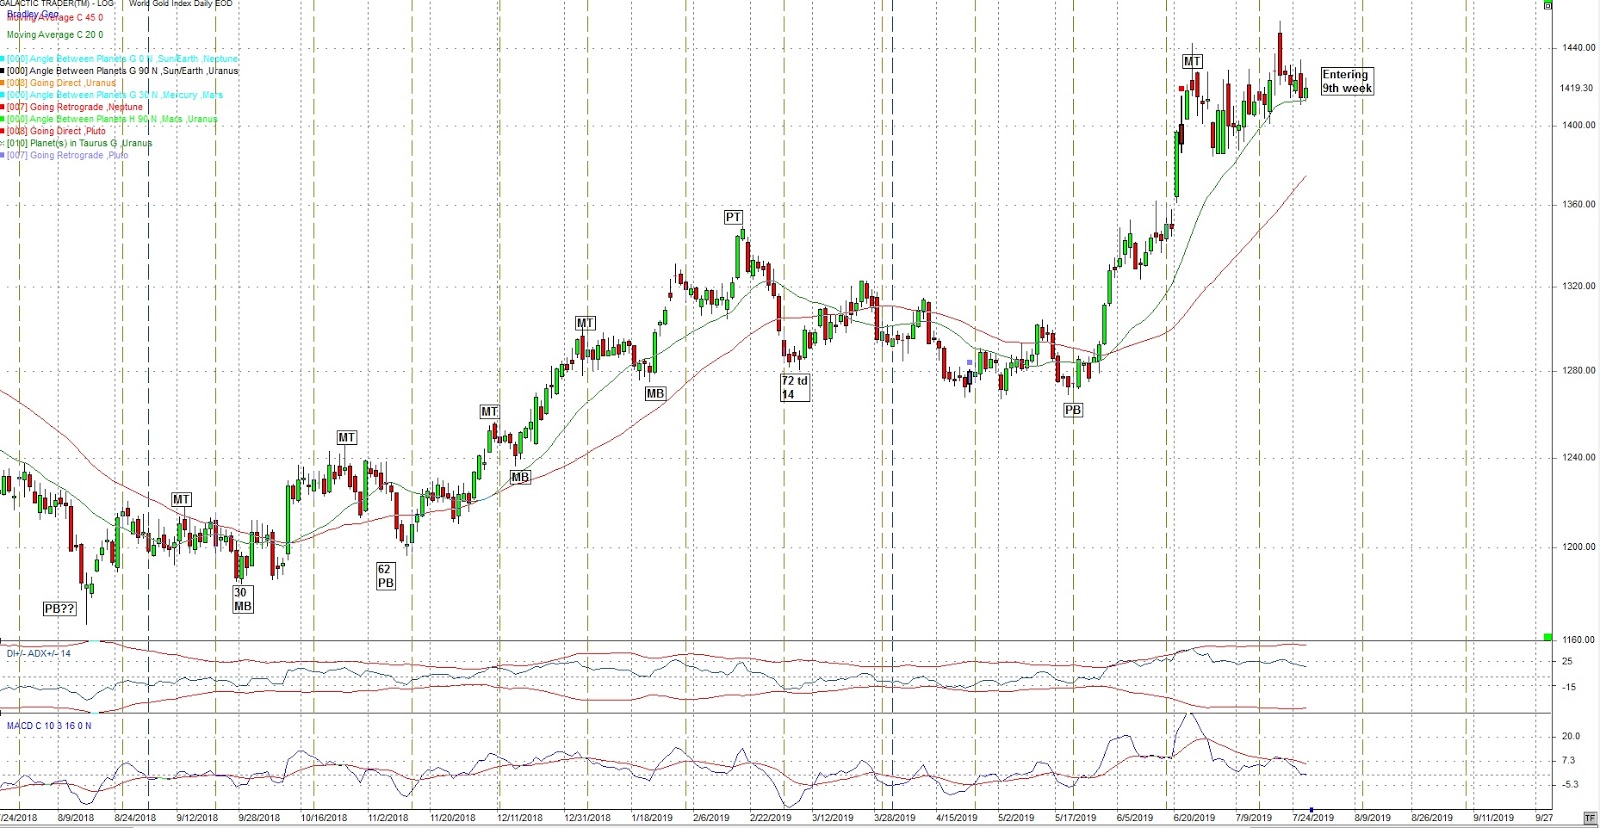
Gold I am long Gold. I have been looking for Gold to rise.
Gold is in the 6th week of the new 18 week Primary cycle. This would be another reason for Gold to go down here. and is due for a 6 week cycle trough. Note the high was on June 25th.

It may be time to sell if Gold breaks 1380 or we are on our way to a top similar to the Nov 2011 high. June 30 starts the translation of heliocentric Mercury in Sagittarius. The latter can mark a period of rising price or a period where Gold price changes trend.

Crude's Crude started up on Dec 24, 2018. We are either entering the 24th week of the Primary cycle or we started a new Primary cycle on June 5 and we are 21 days along.

From two weeks ago:
“We should be headed down but watch for this to reverse into a Primary cycle bottom. Watch for OPEC moves”.

We may have had the Primary Cycle trough for crude oil on June 5. This needs more confirmation. Crude may be quite volatile over the summer months and into the late summer (i.e. Sept 21, 2019).

SP500
We are currently entering a new Primary cycle starting on June 3, 2019. We are 23 trading days along.  

I’m looking at this as a Primary cycle trough and going up in a new Primary. The new Primary started on June 3 and we are 5 weeks along. Remember the Jupiter square Neptune where lies are covered up and general untruths are spoken. It is still in orb.

The Primary cycle is approx.18 weeks and is typically composed of 3- 6 week sub-cycles or 2-9 week sub-cycles or a combo of both.

The 15 day sma is red, the 45 day sma is blue and the light blue is the 200 day sma. Note; the normal Fibonacci retracement levels are 23.6%, 38.2%, 50.0 %, and 61.8%.

One can also use extended retracements which typically use the square roots of one of the above. So, I also use SqrRoot(61.8) = 78.6  and SqrRoot(78.6) = 88.6.

The green vertical lines are a 27 CD (calendar day) cycle next due July 11, 2019.


The above daily chart shows upcoming medium term cycles at the bottom of the chart.

Light blue is the 40-week
Red is the 20-week
Light green 10-week
Brown is the 5 week

Whenever we get longer term aspects we should look at other planets in transit that may hit the longer term aspect.

When looking at any Astro analysis for 2019 we should remember the effect of Jupiter square Neptune and Saturn conjunct Pluto. These aspects will be with us all year and beyond.

All dates +- 3 td’s (trading days) at a minimum.

See the Bradley Indicator at the end of this section.

I am looking for the SP500 to reverse or at least stop rising next week.

The following daily chart of the SP500 is what we have been showing under the 24 Harmonic chart. This is the basis of what we have been forecasting on.

Following is the 24 Harmonic chart we have shown for many months.


The next hits are July 9, 2019 then Aug 22, 2019.

From the last few posts:
“This coming year could see an increase in geophysical activity, both earthquakes and volcanos. Late June through early July may see more geophysical activity.”

See the link under “Earthquakes”. This is an application from the USGS. Geophysical activity has been picking up.

On a longer term basis the following monthly chart of the DJIA  shows the 15 year cycle (red vertical lines) and the 45 year cycle (blue lines). The 15 year is due now or took place April – June 2018. The 45 year due in Sept 2019. This is another example of a longer-term cycle possibly distorting shorter term cycles. Bear in mind they need a broad orb.


Although we do not have enough data the 45 year cycle is pointing to Sept 2022 this could also be the 90 year cycle. We do not have enough data to make the 90 year call. For a 90 year cycle I’m looking at the years 1842 – 1932 and then 2022.

The following daily chart of the SP500 shows 2 Envelope channels. Red is the centered 
20 week envelope channel. Blue is the centered 40 week envelope channel.

The blue squares are the dates of the Mars square Uranus transit. Next up July 11, 2019.


The red averages are based on the 20 week so they are shifted 10 weeks or a ½ cycle. This is known as a centered moving average.

I brought up Iran on the last couple of posts. Iran may be active starting today if they were responsible for the attack of the crude ship. Watch the period around July 13, 2019 for problems with Iran. July 13 has transiting Hades conjunct natal Vulcanus  in Iran;s chart. These two points are from Uranian Astrology.

Watch for news from India and Pakistan as well.

The Bradley Indicator
This stock index forecasting tool was designed by astrologer Donald Bradley and published in 1947 in a booklet titled "Stock Market Prediction".
On the cover this tool is called the Planetary Barometer and inside the booklet it is called a Siderograph. Now it is simply called "the Bradley". The

Bradley is meant to forecast major and minor turning-points (where a trend will reverse) in either the Dow Jones Industrial Average or SP500 indexes. Bradley's work was obviously on the DJIA.

It does not forecast or anticipate whether that turning-point will be a high or a low. It has no polarity. The Bradley may turn up while the DJIA turns down. The amplitude of the Bradley swing is also not important. It only finds periods where trend changes occur.
It should be understood Astrologers in decades gone by who had no computers, spreadsheets, or databases to analyze data typically worked with much smaller data sets than we do today. This maybe why the Bradley worked so well when it first came out in 1947 but now is somewhat unreliable. Now, it goes through periods where it works fairly well but then can stop operating for months at a time. Originally it was for geocentric astrology (Earth centered) but there are now heliocentric models (Sun centered) and others.

In Bradley's own words:
"At no time must the reader gain the impression that a siderograph, as such, is a prediction of what the stock market will actually do. Nevertheless, observation proves that basic reversals in collective attitudes, clearly predicted by the line, are inevitably mirrored in stock averages"

So if the Bradley only identifies trend changes, what are trend changes?
- a rising market changes to a falling market
- a rising market changes to sideways
- a sideways market starts going up
- a sideways market starts going down
- a market going down changes to a rising market
- a falling market starts going sideways

The indicator is pointing to a change in trend for the SP500.


Gold

Gold found support at 1273, in fact it found support there 3 times. We have now moved up and Gold should be in the 6th week of a new Primary cycle which started on May 22. Like any new Primary cycle there may be a pullback in the 2nd or 3rd week. I’m also looking for the 6 week cycle trough.

We’ve had a little pullback now we are pulling back again. This may be the pull back going into a 6 week cycle trough.

I’ve had a bullish view but the US$ has to retreat. Bitcoin has been on the rise


The following chart shows two daily envelope channels. The vertical red lines are a 20 day cycle.


The following chart shows a 27 cd (calendar day) cycle (blue vertical lines). The last being
June 10th The next is July 5th.

The Moon takes 27 days to orbit the Earth and the Sun takes 27 days to revolve once at the Sun’s equator.

The red lines headed up are the Mars price lines. Gold had been moving up and have found both resistance and support at the Mars price line. The darker red Mars lines are the main aspect. Moving below the red Mars price line was bearish now we need to move above the red Mars price line as a positive sign for a move up in Gold. Gold may follow the red, Mars price line up. Watch closely.

The small blue x’s on the chart show when heliocentric Mercury is in Sagittarius. We often see changes in trend in Gold when Mercury enters heliocentric Sagittarius. This with Mars entering Leo may see an effect on Gold.

Looking at this whole chart it is based on a 24 harmonic. If you count each line from one darker red line to the next you will find there are 15 of them. 15 * 24 degrees = 360 degrees.


The following chart shows when Mars enters a new sign (red squares). It often affects Gold. Mars is in Cancer and changes signs into Leo on July 1, 2019. The same day a Uranian point Vulcanus conjuncts Mars. Could be a conflict / war like signature.

Watch July 1 for a change in trend.
Watch for geophysical activity around this time frame.
Mars entered Leo on July 1, 2019. The next day is the Total Solar Eclipse.


Crude

With the problems involving Iran and crude, transport prices may be going up.

I’m expecting crude to go up if problems persist between Iran and the US. Notice price broke through the 45 day sma and the 15 day sma and have fallen back.

We need more confirmation of this being a new Primary cycle.

I am expecting crude and possibly marijuana stocks to be affected by the forming Jupiter / Neptune square.

Jupiter and Neptune are the co-rulers of Crude.

Beyond affecting crude these two planets have to do with illusions and delusions. Thus marijuana stocks.


This puts us entering week 24 of the old Primary cycle or we have just started a new Primary cycle on June 5 and we are in the fifth week.

Following is a chart for crude with the 17 month crude cycle shown as the red vertical lines. The next 17 month cycle date is May 11, 2020