Sunday, November 24, 2013

Financial Astrology - November 24, 2013

SP500
Anyone feeling a little wobbly, this weekend we had the long term heliocentric Uranus Pluto waxing square. Uranus is sudden events and the Iran nuclear deal is certainly that.

If there are Astrologers out there I'm looking at a chart for Iran based on Feb 1, 1979 at 9:30am in Tehran. I use Uranian points and mid-point analysis. I believe this was not the time for such an agreement. I hope this wasn't the U.S. Democrats coming up with an event to distract the public from on-going problems. Before I get emails on this statement, I do not live in the U.S. and not supporting Democrats or Republicans.

I believe we are in the 7th week of the primary cycle and due for a more substantial pullback. Although we did have a 3 day pullback I am expecting more. The difficulty is the FED's QE program. It is supporting the index with false valuations. The FED's economists don't live in the real world and unfortunately, by their actions, are manipulating the market.

Remember the definition of an economist.
"An economist can tell you 100 ways to make love to a woman. But he doesn't know any women".  Before I get emails please reverse for female economists. We'll need to keep our sense of humor over the next couple of years.

Nov 24 we have the Sun in waning square to Neptune. This signature has a history of market turns given a week either side. Neptune is the planet of illusion and delusion and is powerful in it's own sign. On the positive side the Sun just entered Sagittarius which is most often positive for the markets and the days around Thanksgiving in the U.S. also have a positive history.

Nevertheless, all things considered I'm expecting a pullback. We are at a 27/54 week cycle (green line on the following weekly chart) and Nov 28 has geocentric Venus opposing Jupiter very close to the heliocentric North Node of Pluto. A disruptive signature.

The 27 week cycle was on the Nov 17th post. 27 is an interesting number. The moon takes 27 days to revolve around the earth and then approx. 2 1/2 days more to catch up to the earth's movement. The Sun takes 27 days to rotate once at the equator. 27 * 4 = 108 an ancient Indian number.


I would wait for a move below 1,770 as seen on the following Fibonacci expansions chart before considering a short.


Gold
On Gold, the Sun in waning square to Neptune on Nov 24th, also has a history of trend changes in Gold but within a few days. We are in the 6th week of the Primary cycle so a trough could be forming for the 6th week cycle low (major cycle).

If we get a move up it will probably be short as the longer term cycles are pointing to late December or early 2014 for a larger low. Watch the 1233 area for support now.
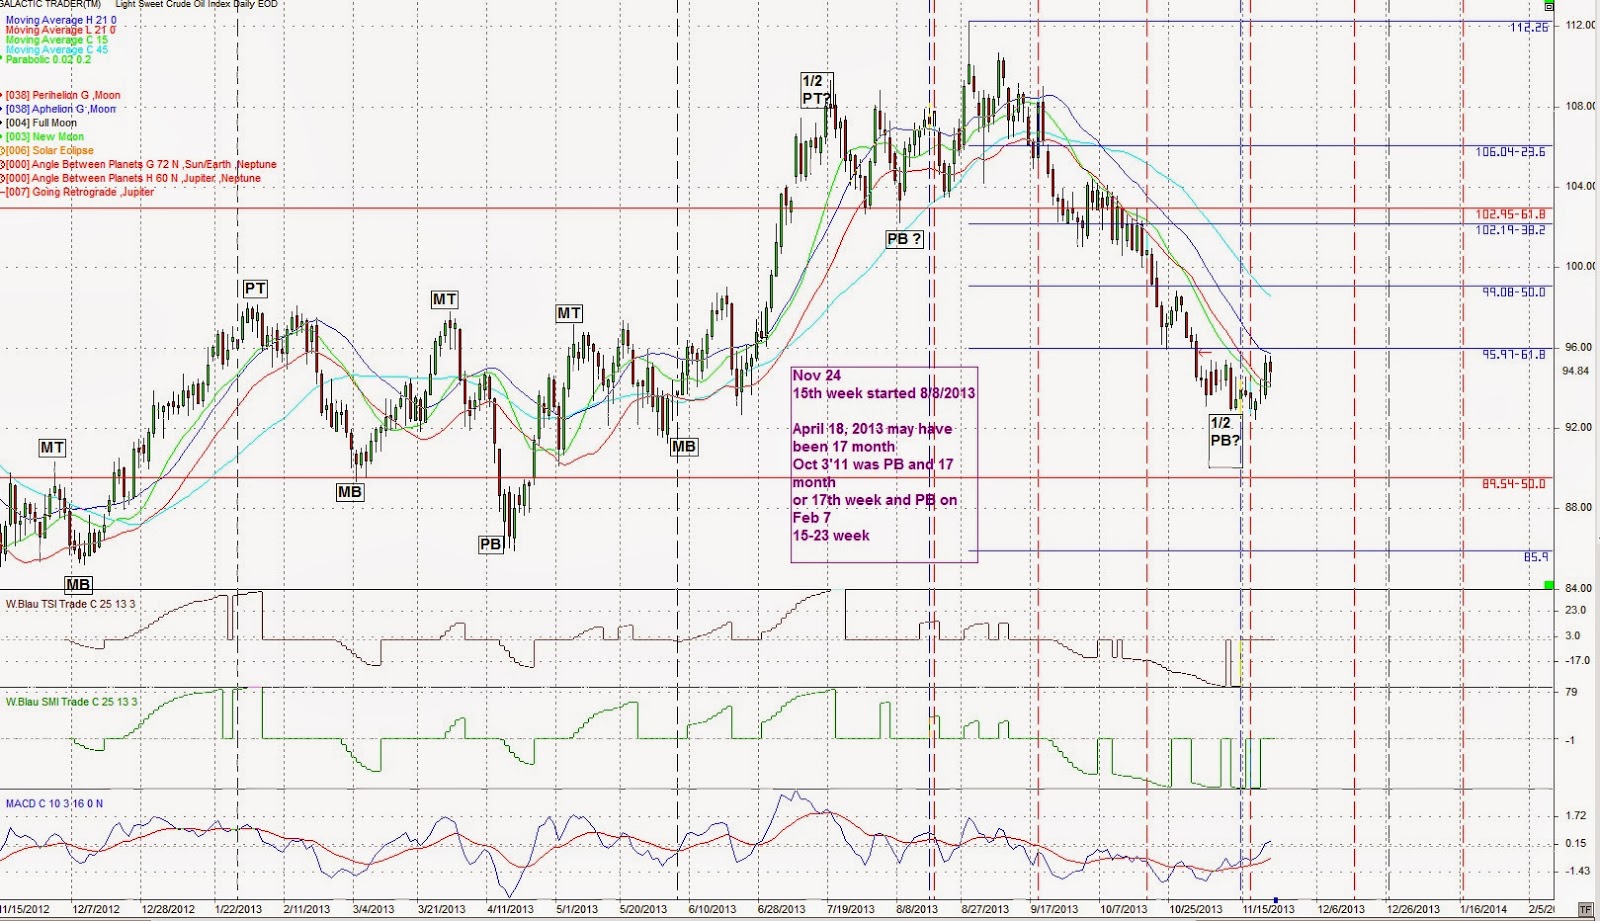


Crude
Although due for a move up I'm waiting to see what effect the Iran nuclear deal will have on the price of crude. If sanctions effecting crude are lifted prices could drop significantly.


Saturday, November 23, 2013

Bradley Indicator 2014

Following is a daily chart showing 3 versions of the Bradley indicator. If you are don't know what the Bradley indicator is use Google or Bing.

From my own work I find it inconsistent but sometimes works. Therefore use it as a possible confirmation of a turn where you have other tools (cycles etc.) anticipating a change in trend.

The indicator does NOT show market direction. It's intent is to show when the market trend changes.

Red - the original Bradley

Green - Shramenko updated Bradley

Blue - Heliocentric Bradley.


Monday, November 18, 2013

Longer Term Update

One of the reasons I was looking for a move down in this time frame was the heliocentric opposition between Jupiter and Pluto.

The following is taken from the July 21 , 2013 post with an updated chart.

"A longer term look at some heliocentric transits. This monthly chart of the DJIA shows a longer term look at heliocentric aspects between Jupiter and Pluto. This shows every third conjunct between Jupiter and Pluto (small red circle is the conjunction, every third occurrence has a light blue circle) is near a crest and then moves down quickly. Also of interest is that every third opposition is close to a strong move down, either just before or just after the third opposition (double red arrow with light blue circle). This could be just before or just after the opposition. The next opposition is Nov 13. Note this is a monthly chart and with these slow moving aspects this could be due at any time."


So the exact date has passed but we are still in the time frame when a pullback could occur.

PS Yellin says the stock market is not in a bubble. She is obviously not stupid, therefore another liar.


Sunday, November 17, 2013

Financial Astrology - November 17, 2013

SP500
I continue to look for a pullback probably but not as far as originally predicted. The market is soaring on the continued FED monetary policy. As far as the FED is concerned watch what they do not what they say. They are taking money from the poor and middle class. The beneficiaries are the  banks. Just look at the last decade. FED monetary policy has been the source of the boom and bust stock market. Another bust is ahead of us. We are in the biggest financial market intervention in history. It's all fiat currency as Gold languishes due to flagrant manipulation. Where is the mainstream financial press. Useless, as they were in 2007 / 2008.

Following is a weekly chart for the SP500 showing the wild swings created by the FEDs monetary policy.


In the middle of such melt ups it will be difficult to call the turn. I'll try and call the approximate dates when we should get pullbacks.

There is a 27 week cycle coming up. Due the week of Nov 25 it could hit this week or the first week in December. Following is a weekly chart of the SP500 showing this cycle (blue and green vertical lines.


This coming week we have Chiron turning direct on Nov 19, the Sun entering Sagittarius on Nov 21 and Mercury transiting over the point of the November 3rd Solar eclipse. I'll add the Sun square Neptune of Nov 24. This often marks turns in many markets particularly equities and Gold. This is the waning trine.

I think we get a turn down in the 1st 3 days of the week.

Don't discount the Sun changing signs. On the following daily chart of the DJIA the red circles are the dates the Sun has changed signs and the light blue circles show when the Sun enters cardinal signs (change of seasons). The latter often being stronger turns.


Something more troubling are heliocentric aspects between Uranus / Pluto and Jupiter. They are forming a heliocentric T-square. I've seen many instances in the past where heliocentric outer aspects can result in stress on the earthly plain.

In addition heliocentric Pluto is quite close to the heliocentric South Node of Jupiter and heliocentric Jupiter is close to the heliocentric North Node of Jupiter.

These could be earthquakes, volcanic eruptions, bad storms or some other surprise disaster including financial disasters. Look to the period from Nov 20 to Nov 28th for an event(s). Unfortunately  I don't know where on the planet and the period could pass with no problems.

Gold
Watch Gold closely early in the week. We are either in the 21st week of the primary cycle (nominal 18 week) or the 5th week of a new primary. Alone this would tell us nothing as it could go up or down. Looking at the dma the 15 dma just crossed below the 45 dma which will be bearish if it does not reverse quickly. A daily close below 1,280/GCZ or worse 1,234/GCZ would be quite bearish.

The price action early in the week should be telling. Silver is pointing to at least a short term move up. I'm watching to see if Gold follows. Bear in mind the precious metals are more easily manipulated than other markets due to their small relative size.


There is another astrological signature which is pointing to a short move up ( a few days) then down possibly to year end or into January 2014.

Crude
I've been looking for a high in Crude around the first week in Jan 2014. This is at the meeting of the 16 and 24 week cycles (blue & red = green). This should mean a crest.


We need to see the 15 dma start to move up and the price rise over the 15 dma. The Sun waning square to Neptune on Nov 24 would be a good signature for a reversal in crude. Remember all dates are +- 3 td's unless otherwise noted.

Natural Gas

NatGas may have put in a bottom at the 56 cd cycle bottom on Nov 1. Note on the following chart of the NatGas ETF this was also the momentum bottom. Price is now over the 15 dma. We need to see the 15dma start moving up.


Sunday, November 10, 2013

Financial Astrology - November 10, 2013

First and foremost we should send a prayer to the souls lost in the Philippines and those under duress in the aftermath of the storm.

SP500
There are a number of long term transits occurring now and the next few years. Some of these are associated with natural disasters. Bear in mind China stopping the purchase of US bonds or the US$ losing it's status as the worlds reserve currency would be disasters. Also keep in mind the FED's QE program carries on which is supporting the market potentially creating the biggest bubble yet.

Just briefly off topic. I have become more convinced earthquake, volcanic eruptions and severe weather events are linked to the activity of the Sun, (sunspots, CME's and x-ray) events. These in turn are triggered by astrological aspects, mainly heliocentric aspects. This is a large area of study and more work needs to be done.

The Philippine disaster may effect a number of economic areas in the short term, for example technology companies with plants in the area. JIT inventory does not perform well in disaster situations. If money is made on trading disaster news consider sending 1/2 or some part to the relief effort.

Bear in mind the dates from the last post should still be valid.

Nov 13-15
Nov 21-22

Heliocentrically there are some heavy transits which may generate more surprises for the next 2 weeks.

I'll keep this chart from a few posts ago to monitor how we progress.


Without repeating previous posts I had been looking for a move down. With Fridays move up and the unfolding disaster we may see a bounce but I continue to look for a move lower particularly from Nov 13 on. Venus will be translating the Uranus / Pluto square on Nov 14/15, the latter date is OPEX. I had originally thought we'd be going down into Nov 22 where we have Mercury passing over the point of the Nov 3 eclipse.

Gold
Gold continues to head down. I'm looking for possible support at the fib levels on the next chart.

The low on Oct 15, 2013 is a critical as is the low on June 28 which I currently have as the 4.25 low.


Short term we may see a short up move early this week. See the following daily chart and the Sun Jupiter aspect falling on Monday.


Crude
Crude looks like it has put in a low or is very close. Neptune, which rules crude is in Pisces and is going direct on Nov 13th.


Watch Coffee as Neptune, which rules coffee, turns direct on Nov 13

Wednesday, November 6, 2013

Financial Astrology - Update Nov 6, 2013

I should have included Nov 7 as a potential turn in the Nov. 3rd post. Bear in mind next week has multiple signatures for a turn.

Nov 7 has Jupiter turning retrograde which can be a turn signal by itself. In this case Jupiter is almost exactly on the heliocentric North Node of Pluto. The planetary nodes are one of the few heliocentric events that can be used on geocentric charts.

Jupiter is co-ruler of crude and natural gas.

Sunday, November 3, 2013

Financial Astrology - Nov 3, 2013

SP500
Bear in mind we could see some unforeseen event over the next few weeks that could change this outlook and possibly effect the world on a broader basis.

On the markets, the time period we've been referring to since the June 16 post has arrived.
It should be volatile in many markets with one or two pullbacks. The SP500 could go up some more early in the week then down. This is not the big crash.

The US$ appears to have put in a 40 week trough which may not be good for Gold and Crude in the short run.

The days the market could move, and probably down. These dates include SP500 and Gold.

Nov 6
Nov 11
Nov 13-15
Nov 21-22

The following daily chart of the SP500 shows Fibonacci extensions and it just hit 138.2% and appears to have met resistance. The fib's are from point A to point B then taken off of C.


The SP500 also hit the Neptune price line (grey) 


And from a few posts back, the index went higher than forecast. We'll now see if the timing was correct.


Gold
Gold looks like it's breaking down. It's 1st retest is in the 1,250 area then the low on June 28 at the 1,179 area. Cycle wise Gold may be going down into the end of the year if it gets started here with the US buck on the rise.


US$
The last red square should be the 40 week low.


Crude
Also looking for a low. Key dates are:
Nov 7
Nov 13-15