- Our first half 2016 forecast dates are available
- Subscriptions include the forecast dates and a monthly Market letter with eMail alerts for imminent trading opportunities
- We do not use negative option billing nor do we sell email addresses
- Subscriptions include the forecast dates and a monthly Market letter with eMail alerts for imminent trading opportunities
- We do not use negative option billing nor do we sell email addresses
Our posts are now reported on the highly regarded FXStreet.com.
SP500
This post will be a little shorter
than normal as I'm working on the subscribers March report.
For the SP500, cycle-wise Feb 11 looks like the Primary cycle
trough. 1
that started on Aug
24th. Feb 11th was a slightly
lower low than Jan 20th low. Feb 11th
should start a new nominal 18 week cycle and we are entering the 3rd week.
My outlook is bearish going into
the Spring due to the Astrological aspects being formed, namely the Saturn / Neptune square and the Jupiter / Saturn square. There are
others. The Saturn / Pluto square is
still in orb but will soon be fading. March through June of 2016 looks troublesome
and bearish. I'm looking for two lows from now into June with one of the lows
coinciding with the current nominal 18 week cycle.
Currently the 18 week cycle trough
would be the week of June 13 +- 3
weeks so the range is the week of May 23rd
to the week of July 4th.
The nominal 18 week cycle is only
3 weeks along and under normal circumstances would be bullish, at least the
most bullish part of the cycle. Primary cycles are the most bullish in the
early part of a cycle and usually get a rally.
The rise off the Feb 11 low is
just what we would expect Price is now above the 15 day sma and 45 day sma and
the 15 day sma is curling up. The 45 day average is the 1/2 cycle to the 90 day
or 18 week and the 15 day average is the 1/2 cycle to the 30 day or 6 week.
The length of the rally is what
I'm looking for. If bearish this cycle should be left translated, that is the
crest should occur in the first 1/2 of the cycle. Also remember our comments
that near the start of a new Primary cycle we often get a pullback in the 2nd or 3rd week which gives traders an
opportunity to buy what is usually the most bullish part of the cycle. This
doesn't do so well when we are in a bear market as the crest may be left
translated and right around the corner. Feb 24th could have been that pullback
and it was brief.
I'm expecting a volatile
environment in the markets. I'm also expecting geophysical events, possible violent weather and potential terrorist
event. Watch the first couple of weeks of March and again in mid-April. Mars leaves Scorpio, where it has given
Gold a huge thrust and enters Sagittarius on March 5. This results in
both Mars and Saturn in Sagittarius , a signature for a religious war or the amplification
of one. Water may be a problem,too
much in some areas, none in others. Let's see if this makes the news.

I believe we are close to longer
term cycle bottoms, both the 6.5 - 7 year cycle and the Kitchin cycle, 3.3
years (or 40 months) if it didn't occur on Feb 11th.
I'll be watching the U.S.A
financial system closely in follow up to the video from last week. This should
be a long process. Note in the video the last similar occurrence took almost one
year to see an effect.
See the following VIDEO. From Last Week
From last weeks blog:
"We also have a Full Moon in Virgo, a mutable sign, on
Feb 22nd, which has been present at short term market turns and big range days."
The Sun conjunct Neptune on Feb 28th is often a confusing time
where there maybe a sense that things are getting better or bad and getting
worse. In short a poor realization of what is really happening. This transit
has a strong correlation to turns in the Primary cycle but it would be
difficult to imagine a crest so early in the cycle.
Sun conjunct Neptune
also has a history of crests in Gold +- 2 tds and a move down thereafter.
Heliocentric Mercury leaves Sagittarius on Feb 26th. We saw large price swings in the US indices and Gold.
The month of March has two
eclipses, a Total Solar Eclipse on March 8th and a Lunar Eclipse on March 23rd. These are powerful events. Details are
reserved for subscribers.
Following is the Total Solar
Eclipse.

With the longer term market cycles we use the Astrological
aspects and Astro events to determine a more exact time. Longer term geocentric
Astrological cycles include:
Uranus waning square
Pluto
- passed the exact but still in orb (1 degree). This square
will slowly dissipate over this year.
Remember what this square is about.
"This aspect has a historical association between
anarchic uprisings and problems with
debt and Banks. The debt issue will have major negative consequences for all
financial markets.
Other events associated with this square are protest
movements, social unrest and perhaps mob violence. Tax revolts fit in as well.
The square is about tearing down the
old structures (governments, financial institutions) and building anew. Although Uranus is about sudden
change and surprises, Pluto is about long term changes that will not be undone.
It is ruthless in it’s force to change the status quo. We are only 1 degree
away from the exact Uranus and Pluto square."
Jupiter waning square
Saturn
- in the middle of a 3 pass, 2 exact hits to come this year
"The business cycle and direct effect on European
history. Major changes will be occurring in Europe
as result of the refuge migration. There is a major sign change coming up when
Jupiter and Saturn are conjunct in 2020. More on this 240 year conjunction in a
future post."
Saturn square Neptune
-in the middle of a 3 pass, 2 exact hits to come this year
"This aspect is often present near times when there is
a change in trend for interest rates or inflation. It can also be a period of
epidemics, pandemics suffering, depression and money valuation problems. This
could be a change in the world's reserve currency or issues around it. A large
increase in precious metals is also possible as it is a money valuation issue.
This 36 year aspect has been associated with political changes, reforms and
development of socialism. One wonders in regards to epidemics and sickness,
would this be natural illnesses or man-made." If you feel depressed or not
at ease this aspect may be the cause. One of these planets may be hitting a
planet in your horoscope.
On
the following weekly chart of the DJIA, the red squares are Jupiter square Saturn and the green squares
are Saturn square Neptune . The two lows
mentioned above should be completed by the last green square.

For
2016 we have Jupiter, Saturn, Neptune and the North Node in mutable signs. In addition both
Solar eclipses are in mutable signs. Mutable signs are about flexibility
and the ability or need to change. They are also about things that are not in
control and extremes.
Saturn is in Sagittarius which
rules the law, religion, philosophy and science. With the square to Neptune is a good signal for a religious message that
gets perverted. Time for change to judicial systems? It's a time period where
things seem depressing. With Mars joining Saturn in Sagittarius on March 5th
watch for a pickup in current hostilities.
Charts we have not shown for awhile.
The first 3 charts are daily charts of the SP500, the Russell 2000 and the
NYSE. The horizontal blue lines are the average longitude of the planets
Jupiter, Saturn, Uranus, Neptune and Pluto on all 3 charts This average is
converted to price and displayed on the charts. Notice how well they have acted
as support and resistance. The SP500 may hit resistance close to 1968. The next
level is 2013.


The other chart we haven't shown
for a while is this Fan which started on March 6, 2009 at the low. The dark
blue line has acted as support most of the way up. It is the 50% line or 45
degrees. The red line we have just touched is 61.8%. It hasn't been touched
since Oct. 2011. The black vertical lines are 512 cd's (calendar days) which
next falls on March 9, within one
day away from a powerful Total Solar
Eclipse. March 8, 9 may be powerful days in the markets. I'm not
discounting a geophysical or severe weather event during this time period.

Other longer term cycles that may
be close to seeing their lows in the next couple of months are the 6.5 - 7 year
cycle and the Kitchin cycle (40 months). Kitchin may have hit it's trough on
Feb 11th. I'm looking at the period from now
through the spring of 2016 as a potential time period for these cycles.
They are long term cycles and need a broad orb.
Following is the Kitchin cycle on
the SP500 chart. This is a monthly chart. The
Kitchin cycle is 1/4 of the synodic Jupiter / Uranus cycle.

Other long term cycle due,
including the 6.5 - 7 year.

The following weekly chart shows
the 21 and 34 weekly moving averages and the fact price broke through both
averages Also the 21 and 34 week moving averages are pointing down.
The question is, do we have a significant low in front of us.
At this point I think yes. I'm thinking potentially
deeper in the spring time frame in 2016.

"What everyone is looking for, is what is
looking."
-- St. Francis ofAssisi
-- St. Francis of
Gold
Gold put in a nominal 18 week cycle 1
trough on Dec 3rd. 2015 which has marked an
important low.
This puts us entering the 13th week of the Primary cycle and entering the 7th week of the 2nd nominal 6 week cycle during this coming week. The nominal 6
week cycle has a range of 5 to 7 weeks.
From last weeks blog:
"We may be near
the peak of this cycle."
Feb 11 looks like it was the peak of the cycle. I'm now
looking for Gold to trend down into the nominal 18 week cycle trough which
should be late March or early April.
As we've mentioned before Mars in Scorpio often results in big moves in Gold both up and
down. Mars entered Scorpio on Jan 3,
2016 and will leave Scorpio for
Sagittarius on March 5, 2016. Due to retrograde motion Mars will be back in
Scorpio later in the year, May 27th
in fact, 1 day after a Jupiter / Saturn square.
In addition to Mars in Scorpio heliocentric Mercury entered Sagittarius on
Feb 15th and will
leave Sagittarius on Feb 26th, the
date mentioned in the video above under the SP500. We often see large price
moves when Mercury is in Sagittarius in stocks and particularly precious metals. Will this time period end the sharp
move in Gold? Watch the fib retracements on the following
chart for both support and resistance areas. I'm looking for a move down into
the Primary cycle low over the next few weeks. This could be a shortened
Primary cycle.
Following is a daily chart for Gold/ The blue x's show Mars
in Scorpio. The red x's show heliocentric Mercury in Sagittarius.

In addition the following is a daily Gold chart showing
price is still above the 15 day sma. I'm looking for Gold to break below the 15
day sma quite possibly by late next week. Note the two indicators, Momentum is
pointed down and MACD is rolling over.

From last weeks blog post:
"It also has a 14 cd cycle you can see in the bottom
right area of the chart (orange vertical lines). If active it hits Feb 25th. Watch for Gold pullback. All dates are
+- 2 td's at a minimum."
I'm expecting a bigger move in Gold later in the year,
possibly at the end of this Primary cycle which may also be a 17 month cycle
low. The move should be up. Subscribers have the potential dates.
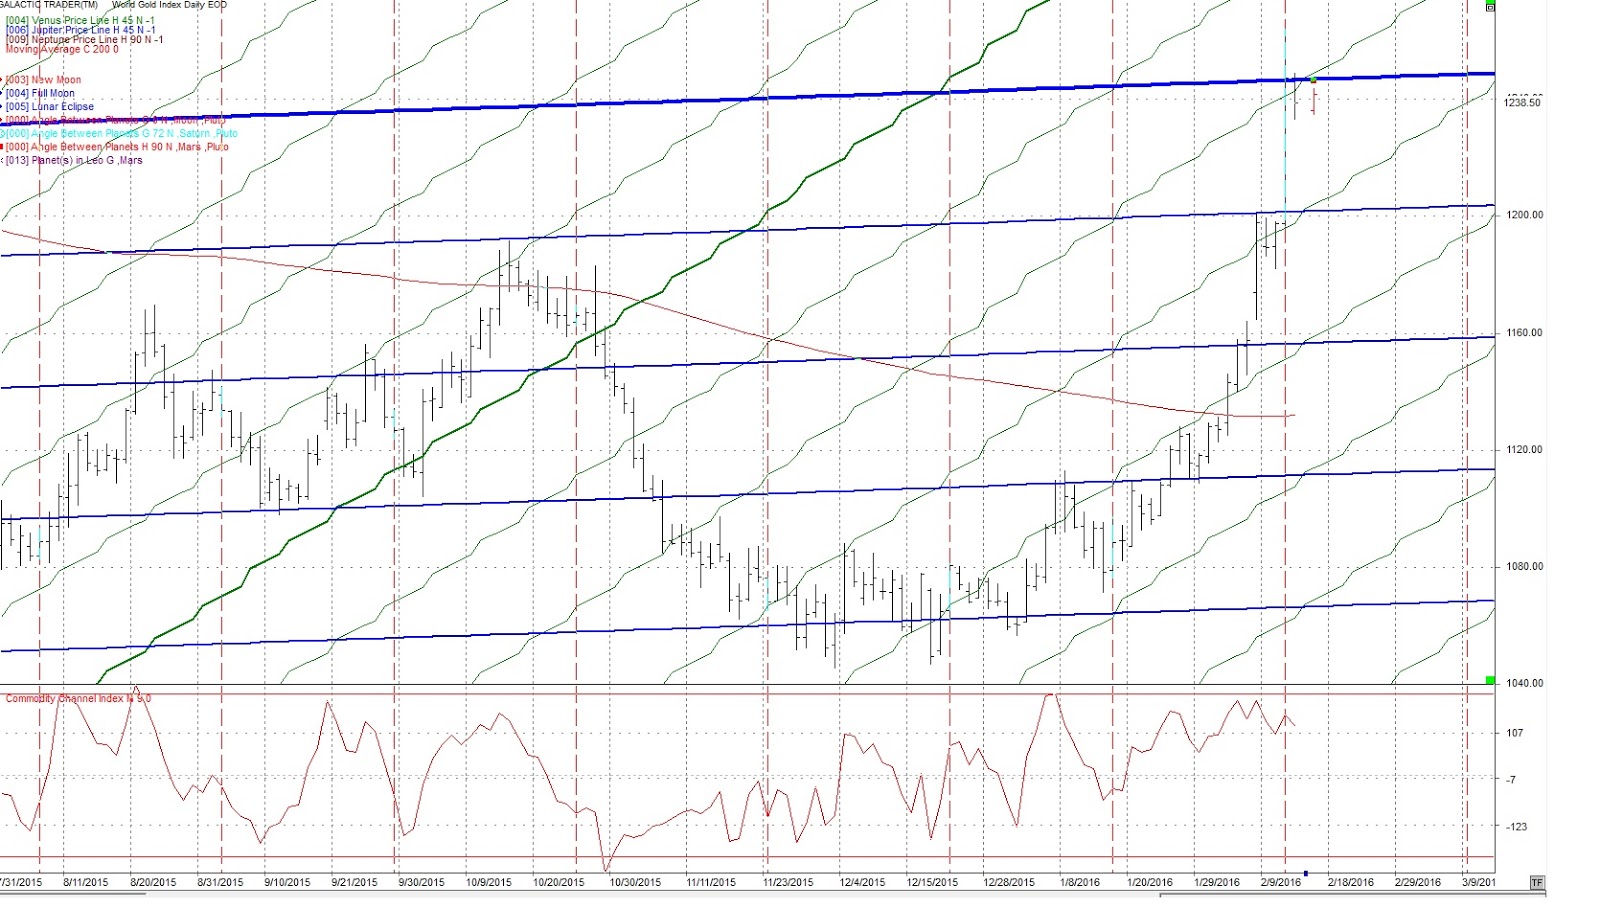
The price lines on the following daily Gold chart take the
longitudinal position of the planet and converts it to price. Venus (green) and
Jupiter (blue) have provided good support and resistance. Gold peaked above the
blue Jupiter price line and now moved down through the green Venus price line.
I expect Gold to move below the Venus price line next week and possibly through
the next blue Jupiter price line.

Crude
Feb 11 had another
lower low and is now marked a Primary cycle trough which has us staring the 3rd week of a new nominal 18 week
cycle. Bear in mind there are geopolitical issues affecting crude which can
effect the price quickly and directly. With the comments above under the SP500
Mars will be entering Sagittarius and joining Saturn there on March 5th. This
is a war like configuration and being Sagittarius it would not be surprising if
religion was involved. This could also be pointing to a terrorist event.
I've been looking for Astrological aspects that hit Jupiter
or Neptune. Both are co-rulers of crude. There is one on Feb 28th when the Sun conjuncts Neptune .
This is particularly powerful as Neptune is in
Pisces, the sign that it rules.
Many commodities and financials should be affected by the Saturn / Neptune waning square this year.
This is a 3 pass with the last 2 occurring mid-Year and then September 2016.
This is a 36 year cycle so looking back 36 years we had severe problems with
the lack of crude and interest rates went over 20%. Things are never the same,
but often close as we now have an abundance of crude and very low (negative?)
interest rates approximately 36 years later. These longer term aspects color a
period of history rather than a day, week or month.
Looking at the crude chart we see a Primary cycle low now on
Feb 11. The last cycle is an example
of a left translated cycle with the crest forming closer to the beginning
trough. Left translated cycles are bearish, they simply spend more time going
down than moving up. After 7 years of QE in the U.S. and loose monetary policy we
haven't seen many left translated cycles for some time.
It appears we are now in the 3rd week of a new nominal 18 week cycle. I've mentioned before when
a Primary cycle trough is formed it is usually bullish and we typically get a
short dip cycle 2 - 3 weeks after the 18 week cycle trough. This gives traders
the opportunity to get in if they missed the original trough. In this market
this is a good strategy as the 18 week low could be lower a number of times as
we wait for geopolitical events to unfold.
Any type of armed conflict which affects ships, docks or
blocking shipping lanes could quickly move crude prices.

Other items, more specifics on the SP500, Gold and crude
also US$, NatGas, Coffee reserved for subscribers. At $99.00 for a 6 month subscription, can you afford not to have it?
The 1st half 2016
dates and subscription to the monthly letter (starting in Jan) are available
for purchase.