- Our first half 2016 forecast dates are available
- Subscriptions include the forecast dates and a monthly Market letter with eMail alerts for imminent trading opportunities
- We do not use negative option billing nor do we sell email addresses
- Subscriptions include the forecast dates and a monthly Market letter with eMail alerts for imminent trading opportunities
- We do not use negative option billing nor do we sell email addresses
Our posts are now reported on the highly regarded FXStreet.com.
This weeks blog post will be a little shorter than usual as I am
writing the subscribers monthly report for April. April is shaping up to be
quite an unusual month.
This blog post covers the markets
up to the end of March 31. The subscriber letter will be out on the weekend and
will cover up to the end of April 1st. There is an interesting aspect tomorrow
and if it effects the market or world events, I would want to include it in the
subscribers April report.
A general note. I'm expecting
volatility and possibly a big move in the markets in the April to end of June
timeframe. There are also some violent aspects which could be pointing to
war-like activity or terrorist event. These are mainly mid-month as are
geophysical events and violent weather.
SP500
For the SP500, cycle-wise Feb 11 was the Primary cycle trough. 1
that started on Aug
24th. Feb 11th was a slightly
lower low than Jan 20th low. Jan 20th was the low for a number of other
indices. Feb 11th starts a new nominal
18 week cycle in the SP500 and we are entering the 8th week. We most often see a
nominal 6 week cycle to start a new nominal 18 week cycle and this time was no
exception. The crest is MT and the trough is MB on the following chart. The nominal
6 week cycles has a range of 5 to 7 weeks so we are in the time frame for a
crest for the new 6 week cycle.
Normally we would expect the SP500
to continue up in the 2nd nominal 6 week cycle in the primary cycle. In the
current case we have a number of difficult transits and Astrological events
that may directly effect the markets or a world event that indirectly effects
the market. One that stands out is the Jupiter
/ Uranus parallel which is in aspect most of the month of April. On the
surface this would be interpreted as being very positive and potentially very
sudden good fortune. Jupiter however is in Virgo which is Jupiter's detriment.
The sign it works with the least power. A parallel is an aspect of declination.

Price is above the 15 day sma (red
moving average) and the 15 day sma is above the 45 day sma as expected in a
bullish environment. A turn down here could be a slightly left translated cycle
which would be bearish.
My outlook is bearish going into
the Spring due to the Astrological aspects being formed, namely the Saturn / Neptune square and the Jupiter / Saturn square. There are
others. These 3 planets will be forming a powerful T-Square in mutable signs.
I mentioned an unusual / possibly explosive environment in April and the dates
and potential events will be included in the April monthly subscribers report. For purposes here watch out early in
the month and near the 3rd week of April.
As the
first date is at the end of this week I will mention April 1st as the
first potential date. Most of April we are under unusual energy and there are
unusual Astrological formations occurring. On April 1 there is a forming
conjunction between Uranus and Eris. Uranus is sudden, surprising events and
Eris is strife and discord. On April 1 Mercury will transit this forming
conjunction and could set it off. This could be viewed as another terrorist
attack or act of war. Something sudden and unexpected. This is only the first
of a number of potential problem dates that will be included in the subscribers
report.
Keep in
mind when we forecast dates and events we are looking at the energies generated
and try and interpret what will manifest in physical reality and it's not just
a difficult feeling or problem.
The Uranus / Pluto square is still in orb but will soon be fading. March
through June of 2016 looks troublesome and very volatile. I'm looking for two
and possibly 3 lows from now into June with one of the lows coinciding with the
current nominal 18 week cycle. The new
nominal 18 week cycle which started on Feb 11 is therefore forecast to end
as a trough approx. 18 weeks hence. That puts us in the week of June 13 with a range from May 30
to July 4th
The week of June 13th, just discussed is the week for the next Saturn / Neptune waning square with Neptune
going retrograde earlier in the week. This is a potential time for a more
significant low. It could also be a time that epidemics break out or lingering
disease. This could also involve water.
Last week we had the Jupiter square to Saturn on March 23
which is 2 days before Saturn turns
retrograde and we got the turn down in many markets we were expecting.
There was also a Saturn parallel Pluto aspect on Feb 9, 2 days away from the important
Feb 11 date. Watch the days around April
28 for a possible low or start of a move down when Saturn is parallel Pluto
once again.
The rise off the Feb 11 low has been
more bullish than normally expected but this may be due to the planets in
changeable mutable signs. Price came
down and touched the 15 day sma but did not break through it.
Mars leaves Scorpio, where it has
given Gold a huge thrust up and entered Sagittarius on March 5. This results in
both Mars and Saturn in Sagittarius , a signature for a religious conflict or
the amplification of one. Water may
be a problem, too much in some areas, none in others.
I'll be watching the U.S.A
financial system / currency in follow up to the video from the February 29 post. This should be a long
process. Note in the video the last similar occurrence took almost one year to
see an effect.
With the longer term market cycles we use the Astrological
aspects and Astrological events to determine a more exact time. Note: I have
taken off the brief description of the Uranus / Pluto waning square. Longer
term geocentric Astrological cycles that are coming up include:
Jupiter waning square
Saturn
- in the middle of a 3 pass, 2 exact hits to come this year
"The business cycle and direct effect on European
history. Major changes will be occurring in Europe
as result of the refuge migration. There is a major sign change coming up when
Jupiter and Saturn are conjunct in 2020. More on this 240 year conjunction in a
future post."
Saturn square Neptune
-in the middle of a 3 pass, 2 exact hits to come this year
Saturn is about social order, structure and regulations. Neptune can be politically unrealistic and a desire to
avoid confrontation. It can be devious, underhanded and use subversive tactics.
"This aspect is often present near times when there is
a change in trend for interest rates or inflation. It can also be a period of
epidemics, pandemics suffering, depression and money valuation problems. This
could be a change in the world's reserve currency or issues around it. A large
increase in precious metals is also possible as it is a money valuation issue.
This 36 year aspect has been associated with political changes, reforms and development
of socialism. One wonders in regards to epidemics and sickness, would this be
natural illnesses or man-made." If you feel depressed or not at ease this
aspect may be the cause. One of these planets may be hitting a planet in your
horoscope.
On
the following weekly chart of the DJIA, the red squares are Jupiter square Saturn and the green
squares are Saturn square Neptune .

For
2016 we have Jupiter, Saturn, Neptune and the North Node in mutable signs. In addition both
eclipses are in mutable signs. Mutable signs are about flexibility and the ability
or need to change. They are also about things that are not in control and
extremes. We are in for a wild ride for the next couple of months in the
markets and other areas of life.
With all these planets in mutable
signs one might expect a fast changing, exciting, fun environment. Let's not
forget that Saturn is the focal point of a T-Square,
with a square to Neptune . Amongst other
things Saturn is fear. This could be pointing to life
threatening epidemics and with Neptune this
could mean water borne diseases. Natural or
man-made?
Saturn is in Sagittarius which
rules the law, religion, philosophy and science. With the square to Neptune is a good signal for a religious message that
gets perverted. With Mars joining Saturn in Sagittarius on March 5th watch for
a pickup in current hostilities. Mars will be turning retrograde in April. This
is often found at highs or lows in equities. Mars and Pluto will be turning
retrograde within a day of each other. This will probably be the most important
Astrological event for the month.
The first 2 charts are daily charts
of the SP500, and the Russell 2000. The horizontal blue lines are the average
longitude of the planets Jupiter, Saturn, Uranus, Neptune and Pluto on all 3
charts This average is converted to price and displayed on the charts. Notice
how well they have acted as support and resistance. The SP500 is sitting on one
of the averages (2058) which is based on planetary longitude. We'll see over
the next couple of days whether this is support or resistance. I'm thinking
resistance.

The second chart is the Russell
2000. This index is subject to far less manipulation than the SP500. Notice how
well it respects the Astrological average price lines. It's too bad we have to
bring up manipulation but the reality is, it happens.

The other chart we have been
showing is this Fan which started on March 6, 2009 at the low. The dark blue
line has acted as support most of the way up. It is the 50% line or 45 degrees.
The red line we have just touched is 61.8%. It hasn't been touched since Oct.
2011. The red vertical lines is a 512
cd's (calendar days) cycle which fell on March 9, within one day from
a powerful Total Solar Eclipse. 512 cd's, calendar days is a fairly long
period so we should allow +- 5 td's. Unless the SP500 moves down much further
this cycle has failed. I'll watch it this week and if we haven't had a strong
move down I will put this in the cycles graveyard.

Other longer term cycles that may
be close to seeing their lows in the next couple of months are the 6.5 - 7 year
cycle. I'm looking at the period from now
through the spring of 2016 as a potential time period for these cycles.
They are long term cycles and need a broad orb. Assuming the 2009 low was an 18
year cycle low, we may be looking at a 9 year cycle low late 2017 - 2018.

I was asked for my long term view
and here it is. I'm looking for the world wide economy to be basically down
until 2020. This coincides with a long term Astrological phenomenon known as
Tigonalis which involves the Jupiter / Saturn conjunctions. Every 240 years the
conjunction of these planets changes elements. In 2020 the Jupiter/ Saturn
conjunction will occur in Aquarius, a fixed,
air sign. I expect dramatic technological developments leading into this
time which should be, like the internet, life-changing developments.
The following daily chart of the
SP500 shows the 45 cd (calendar day) cycle. Red vertical lines. This March 30.
I'm giving this +- 3 tds. Look at the recent activity. It has been at lows and
at the beginning of dramatic moves down. Watch this closely for the nexty few
days.

"Prediction is very difficult, especially about the
future."
-- Neils Bohr
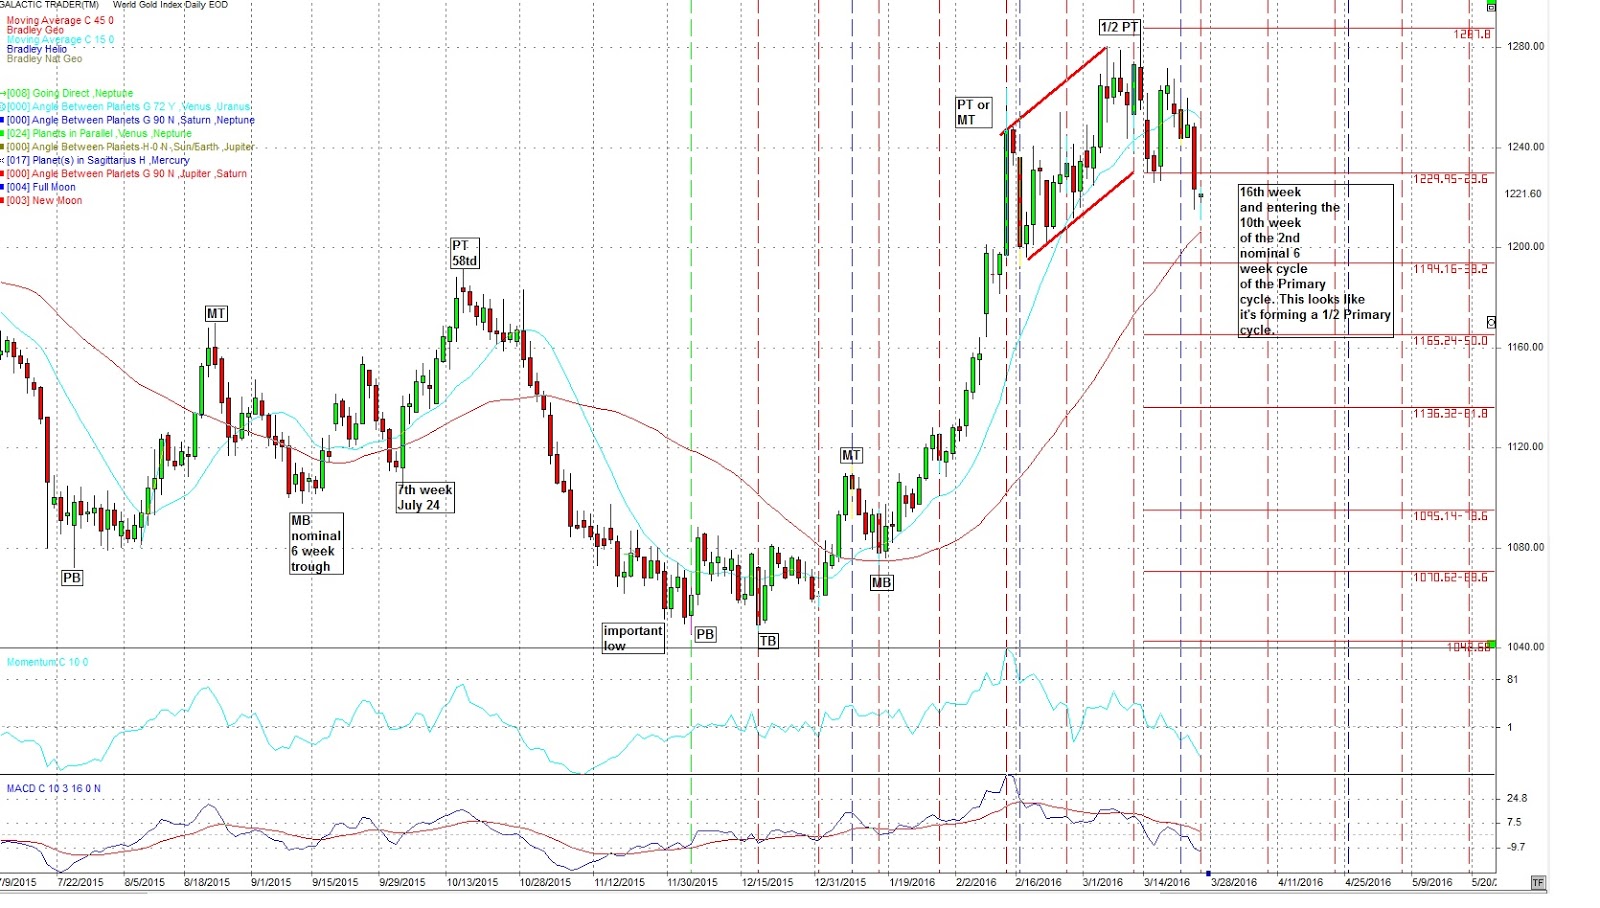
Gold
Gold put in a nominal 18 week cycle 1
trough on Dec 3rd. 2015 which has marked an
important low.
This puts us entering the 18th week of the Primary cycle and entering the 12th week of a 1/2 Primary cycle during
this coming week.
As we've mentioned before Mars in Scorpio often results in big moves in Gold both up and
down. Mars entered Scorpio on Jan 3,
2016 and left Scorpio for
Sagittarius on March 5, 2016. Due to retrograde motion Mars will be back in
Scorpio later in the year, May 27th
in fact, 1 day after a Jupiter / Saturn square. This should be an important
period for Gold.
Following is a daily chart for Gold. The orange vertical
lines are a 14 cd (calendar day) cycle which has been at highs and lows and hit
on March 24. This was also a hammer doji which is a reversal signal. It
reversed for 3- 4 days but at this point Gold should be looking for a trough
for the current nominal 18 week cycle. Note that price is below the 15 day sma
and that average is curling over.
I'm looking for Gold
to hit it's trough during the 1st or 3rd weeks of April.

Perhaps investors are getting somewhat nervous with fiat
currencies.
"The emperor has
no clothes". Negative interest rates certainly helps.
The FED wants to get inflation rising. Inflation is NOT caused
by rising prices for goods. It is caused by the weakening of the dollar which
requites more money to buy the same goods. Rate hikes would not help with their
stated goal of increasing inflation.
I'm expecting a bigger move in Gold later in the year
The price lines on the following daily Gold chart take the
longitudinal position of the heliocentric planet and converts it to price.
Venus (green) and Jupiter (blue) have provided good support and resistance.
Gold moved down sharply on March 23 but stopped on the Venus
price line (green). It seems to be following the Venus line up. March 28 is a possible low but I'm
thinking of April as mentioned above.

Crude
Feb 11 had another
lower low and is now marked a Primary cycle trough which has us starting the 8th week of a new nominal 18 week
cycle. Bear in mind there are geopolitical issues affecting crude which can
effect the price quickly and directly.
For crude, nothing has changed with the demand, supply
situation or the over flowing storage capacity or the flotilla of ships
carrying crude with no place to unload. There has been no agreement to limit
production quotas. What we do have is many banks around the world holding a
great deal of debt for energy companies. Last week I said "I think I'll just watch for awhile" Still watching.
It appears crude put in a nominal 6 week crest (MT) on March 18 and is moving down to the trough.
Notice it touched the 50% retracement
of the move down from Oct 9, 2015 to the low on Feb 11, 2016. The 50%
retracement was just below the 15 day sma and it is still there. We now have a
spinning top, a point of indecision.

April has a number of war-like / terrorist aspects. Most of
them are to the middle of the month. Subscribers have the dates.
I've been looking for Astrological aspects that hit Jupiter
or Neptune. Both are co-rulers of crude. There are a few, April 8, 13, 24. Watch these dates for possible moves
in crude,.
Many commodities and financials should be affected by the Saturn / Neptune waning square this
year. This is a 3 pass with the last 2 occurring mid-Year and then September
2016. This is a 36 year cycle so looking back 36 years we had severe problems
with the lack of crude and interest rates went over 20%. Things are never the
same, but often close as we now have an abundance of crude and very low (negative?)
interest rates approximately 36 years later. These longer term aspects color a
period of history rather than a day, week or month.
Looking at the crude chart we see a Primary cycle low now on
Feb 11. The last cycle is an example
of a left translated cycle with the crest forming closer to the beginning
trough. Left translated cycles are bearish, they simply spend more time going
down than moving up. After 7 years of QE in the U.S. and loose monetary policy we
haven't seen many left translated cycles for some time.
A chart we haven't shown for some time follows. This is a
daily chart of crude with Jupiter (blue) and Neptune
(grey) price lines on it. They work the same as we have shown for Gold. Notice
crude stopped right on the Neptune (grey)
price line on March 24th.
The technical indicators on the chart have all turned down.

Other items, more specifics on the SP500, Gold and crude
also US$, NatGas, Coffee reserved for subscribers. At $99.00 for a 6 month subscription, can you afford not to have it?
The 1st half 2016
dates and subscription to the monthly letter (starting in Jan) are available
for purchase.