- Our second half 2017
forecast dates are available
- Subscriptions include the forecast dates and a monthly Market letter with
- Subscriptions include the forecast dates and a monthly Market letter with
eMail alerts for imminent trading opportunities
-We do not use negative option billing nor do we sell email addresses
-We do not use negative option billing nor do we sell email addresses
Our posts are now reported on the
highly regarded FXStreet.com.
The next 1/2 year Forecast Dates are available
for purchase.
(July, 1
2017 – December 31, 2017)
Subscribers
receive 6 months forecast no matter when they sign up.
This
weeks blog will be shorter than usual as I write the monthly August 2017 Report
SP500
For the SP500, cycle-wise I’m looking at March 27th as the Primary cycle
trough and April 13th
as a double bottom.
This puts us entering the 18th week of the Primary cycle. We are in the time frame
for the nominal 18 week cycle trough. The exact 18 week would trough out during
the 1st week in August. The range; however, is 15 – 22 weeks.
Price has moved above both the 15 and 45 sma which is what
to expect when the SP500 moves higher. This needs to be watched next week.
Subscribers received an ALERT last Sunday.
The next two weeks will
see a number of Mars aspects. We can expect conflict, social unrest, terrorists
and political upset and volatility in the markets. The latter could be sudden
events dealing with a legislature or parliament. For example, the Sun conjunct Mars (July 26th)
could stand for issues involving the party out of power, the land and homes of
the common people. Weather and agriculture may also be affected. There have
been many fires over the last few weeks, a typical Mars manifestation. Sun conjunct Mars often occurs at times
when there is a steep correction. This
combined with the trough for the 18 week Primary cycle and possibly the 40 week
cycle we should be close to at least a
pull back.
Uranus will be semi
square Neptune from mid-July through
October. This will be a longer period of delusion / deception. It may be
more like a fog that has descended that is confusing. For the markets people
won’t know what the direction will be. A more precise description will be made
available once we go through the changes associated with the Astrological
aspect in late July and mid-August.

In the subscribers report we go more detail on the upcoming
Total Solar eclipse and it’s potential effect on President Donald Trump. This
covers the Saros cycle which traces this cycle back to the period of time John
F Kennedy was assonated.
The following chart shows the 40 week cycle on the Dow Jones chart. At it’s current rate it will
be in it’s trough area close to the trough for the Primary cycle which is the 1st
week in August. The vertical blue lines are the 40 week cycle.

Another cycle that is coming up is the 50 week cycle. These
are shown as the pink vertical lines. The next one is by date is July 24th
but I would say July or August. As I would expect a substantial decline, this
time may be unusual in that the markets have been distorted by Central Bank
money.

I had shown the 7 years chart some time ago. Following is that
chart. The vertical lines are the 84 months (7 year). The short red lines are
the potential orb of influence. You can see the current 7 year is very overdue.

We still have:
-
the 45 year
Saturn / Uranus trine Next due
November 11
-
The 12 year Jupiter /
Pluto Square Next due August 4th
-
The 14 year Jupiter / Uranus opposition Next due Sept.
28
These longer-term aspects need a broad orb and should be +-
a few weeks at least. They have been described in the subscriber report. Note
the Jupiter / Pluto waning square is
often seen close to Primary cycle troughs although there are not that many
occurrences. The next exact square is the first week in August one day away
from Uranus turning retrograde. These two planets together can result in
bankruptcy or other debt problems. Watch for exaggerated threats.
In addition to the above there is a potent transit between transiting Saturn square the USA natal Neptune. Hard aspects to the
USA's Neptune and Mars often coincide with financial disruption. Saturn will
square the USA Neptune and oppose it's natal Mars 3 times in 2017. January,
July and October.
The
effect of Saturn square Neptune is deflationary. With the buildup of credit
in the economy the above aspects could bring on defaults, cash shortages
putting stress on the credit markets. Any signs of deflation or defaults should
cause the central banks to print. Inflation is quite possible after that.
Following is a chart of the SP500 and the Heliocentric
Bradley indicator. The blue horizontal line. Watch for turns in price as the Bradley
makes turns. It has no direction. It just tries to identify changes in trend
and we may see a turn on Monday or Tuesday. Details can be found in section 9
of the subscribers report.

I continue to watch the 24th harmonic cycle (360 / 24) cycles for
short term turns. The brown squares are Sun / Saturn 24 degrees on the
following daily chart. The blue vertical lines are 24 cd’s (calendar days).
June 29th and July14th
were big range days.
The next hits are Aug 11th then Aug 29th.
I have added 3 price lines to this
chart.
Saturn - black
Uranus - purple
These price lines can act as
support / resistance. It has been at highs and lows. Note also when they cross
often gets a reaction in price on a short term basis.

I brought up the August 21 Solar Eclipse in the May
market letter. This should bring significant events in that time frame.
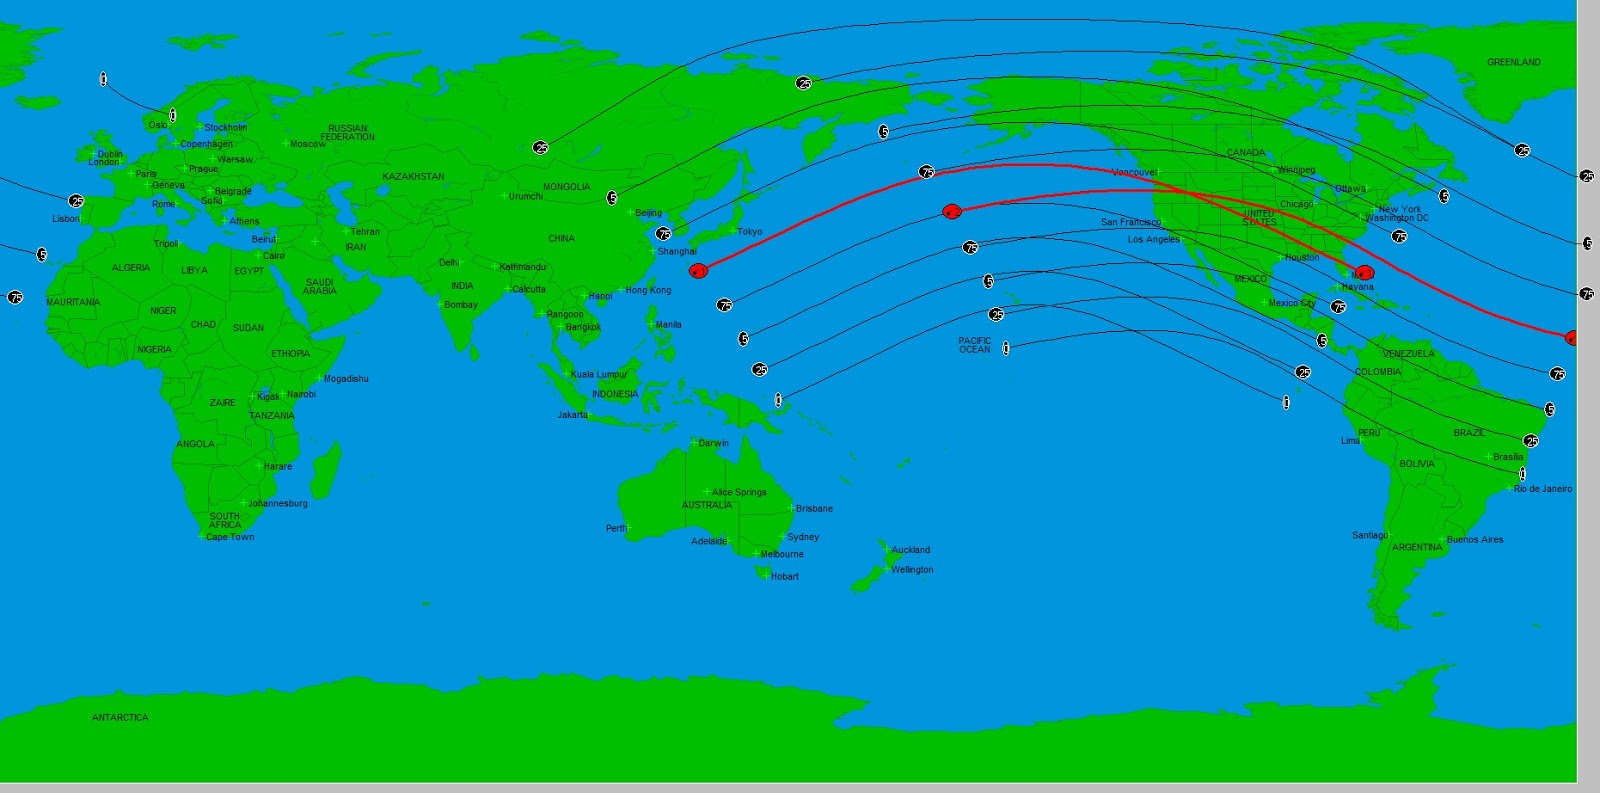
The path of this very important
Eclipse is seen in the following:

For Total Solar Eclipses look for
surprising and important events. I’m going to mention other eclipses that
crossed the USA. I’ll leave the discussion of Saros and Metonic cycles for the subscriber’s
report. This eclipse has Uranus trining the eclipse. This could stand for
scientific or technological breakthroughs. It could also be a military or
terrorist event
This eclipse should also affect President Trump as the eclipse is
within 2 degrees of natal Mars in Trump’s birth horoscope. It is also almost on
his ascendant. This could be a sudden breakthrough or surprising event.
Although a Total eclipse can affect
any place on the planet it is usually strongest in the central eclipse path
(see red lines on these charts)
The following 2 chart shows the
last and the next Total Solar eclipses that cross the USA. The dates are June
8, 1918 and April 8, 2024. The June 8th date is close to the Spanish
Flu breakout.
Includes June 8, 1918

And Including the April 8, 2024
eclipse.

Where the eclipses cross can be a
reactivation of an older eclipse. Note the two crossings in the North Western
states. This is approximately the location of Mount St. Helens.
I’ll come back
to Iran in a future post. I’m expecting more problems involving Iran over the
summer months. It could be around the eclipse window. Israel as well.
Gold
We put in a low in Gold on December 15th, 2015 which
was the 7.4-year cycle low in Gold.
Gold appears to have put in a Primary cycle low on May 9th which would put us
in the 12th week of the Primary
cycle.
I had been looking for Gold to rise into the July 24 – 28
time frame. Among other aspects Mercury
enters heliocentric Sagittarius on July 27th. This latter aspect
can indicate both a move up or the start of a move down. Watch for a sharp move
in Gold July 27–August 6.
If so, watch Gold to make a low in July / August then up.
I’m expecting Gold price to rise in the 4th quarter of 2017 if not
before.
The following chart shows seasonal tendencies for Gold. The
2nd half of the year, on average, is up.

Short term there is a change in trend indicator for Gold.
It’s on the subscribers list of forecast dates for Gold.
I was looking at
precious metals being the potential trade of the year. The “Trade of the
Year” but there will be pullbacks. We may be delayed.
I was expecting Gold to find support in the $1180 area if it
gets down that far. Instead it got support at the 50% retracement level around
1210.

The following chart shows a 27 cd (calendar day) cycle (blue vertical
lines)
The red lines headed up are the
Mars price line. Watch the Mars Price Line to see if it acts as support /
resistance and watch the 27cd cycle, next cycle August 9th.

The next chart is a longer term
monthly chart showing the 7.4 year cycle in Gold. They are the red vertical
lines. Note that the 7.4 year cycle put in a low in late 2015. We are now in a
pull back but we are early in the 7.4 year cycle which should be bullish in the
long term.

Crude
We had the Primary cycle start date as March. This would put us entering the 18h week of the Primary cycle.
There is a possible change, that is June 21 may have been a
Primary cycle low. The move out of that date sure looks like the start of a
Primary cycle. This would put us in the 6th week.
The horizontal blue lines are the average longitude of the planets Jupiter, Saturn, Uranus, Neptune and
Pluto. The horizontal red lines are the Fibonacci retracement from Nov
14, 2016 to Feb 21, 2017.
We broke up through the Planetary averages (Jupiter through
Pluto – blue lines) last week. Crude has moved up aggressively. Watch crude as
it approaches the next blue line (average longitude of the planets Jupiter
through Pluto).
There were a number of aspects involving Jupiter and Neptune,
which resulted in a move up from June 21st. Jupiter and Neptune are the co-rulers of Crude
and NatGas.

I'm watching
all aspects to Jupiter or Neptune,
the two rulers of crude. Crude can also be effected by Pluto as it rules
“things from the ground”. Mars is active during the next few weeks. It may be a
hot summer for temperatures, politics and conflicts be they the USA vs North
Korea or the Saudi’s vs Qatar or terrorist events. Let’s not forget Iran. There
are a number of areas in the world with significant fires and conflicts.
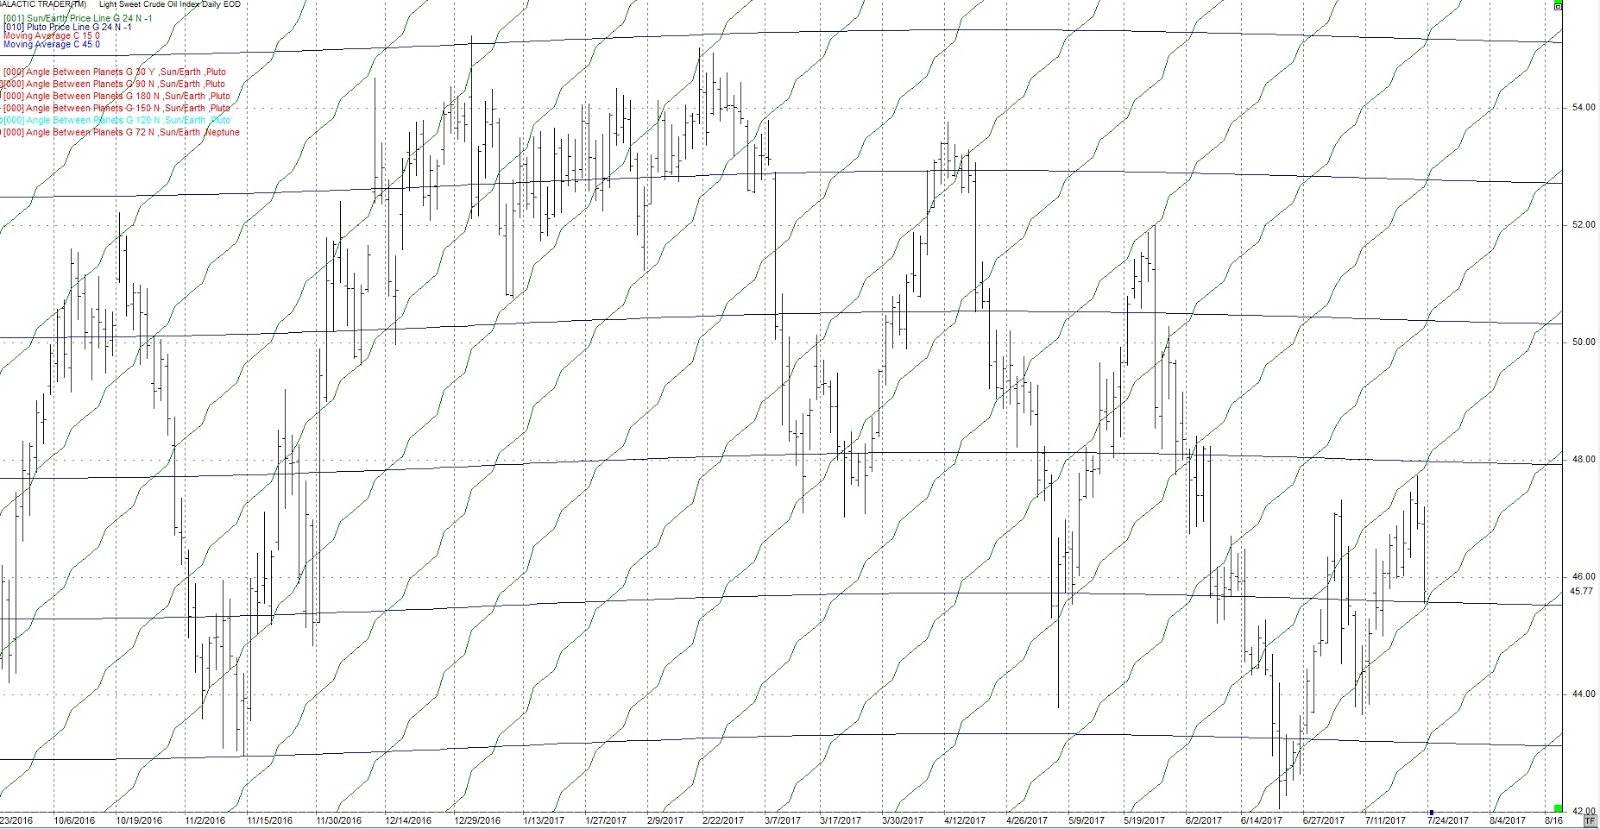
Following is a daily chart of crude
showing the price lines for the Sun
(green) and Pluto (black). Note crude started up around June 21 and has
moved up between two of the Sun Price Lines. Also note, longer term the moves
down have stopped or slowed down around the Pluto price line. Crude price ended
close to both the Sun and Pluto Price Lines.
I’m looking for crude to follow up
the green Sun price line on the chart.

Following is a chart (Sagittarius Rising)
of the USA in the inner wheel and the current time in the outer wheel.

There is a forming square which
will affect the affairs of the USA over the summer and fall months (mentioned
above). This is the square between transiting Saturn and natal Neptune. Note Saturn is retrograde.
The traditional influences are
illusion, delusion, confusion, lethargy and possibly depression. It is as if
everything has taken on a dull sheen. If you were a writer you would call it
the experience of the writer's block. Rather than force matters, take some time
to contemplate your life in a gentle, reflective light.
From a Mundane Astrology
perspective, it covers socialism, and left wing political ideas. It is
associated with mobs, secret plots, fraud, swindling, bogus companies, loss and
liquidation. This same aspect was near exact during the election period. There
are more cycles building during July / August period. More on this in the next
subscribers report.