Summary
SP500. It is possible the recent low was the 4 year low on December 24,
2018 or it is still forming. I’m now thinking of the 4 year being in front
of us, perhaps near year end. See the chart below.
This does look like the Primary
cycle low (18 week) on Dec 24. If so I’m looking for a retest of the December
2018 lows. Things may heat up the following weeks starting Feb 11th.
Volatility should continue and longer term I’m expecting much bigger moves and
changes from 2020 through 2023. More details later.
If the current volatility
continues watch for a cycle turn near February
11, 2019. This is the 33 week cycle.
See further down for the Jupiter
square Neptune on January 13th.
The week of Feb 11 Mars will become more prominent with a conjunction with
Uranus and a change in sign for Mars which moves into Taurus. This follows
Venus changing signs into Capricorn on Feb 3rd.
Gold Gold has made a
sharp move up, something I was not expecting and brings into question where we
are in the Primary cycle. If so, we should watch for a pull back for the
Primary cycle low. Gold should still be the trade of 2019. I may change it’s
status next week.
Crude's Crude started
up on Dec 24. This should be the Primary cycle trough and we are entering the 6rd
week of the Primary cycle.
SP500
The Primary cycle trough was on Dec 24th. We are currently entering the
6th week of a new Primary cycle.
Typically, the Primary cycle has
3, 6 week cycles, or a 9 weeks cycle.
The Price moving averages, the
15 day sma is above price and price is above the 45 day sma.
The string of green box’s are
daily moves of Venus through Capricorn.
The 15 day (red) sma is moving
up and the 45 day (blue) sma is flat. We
may see a pull back during the next 2 weeks.
The recent move down to the
Primary low was timing the 18-week Primary cycle and a 2 year cycle. The longer
term cycles (2 year) can distort the shorter term cycles (18 week). As noted
above we may be seeing the 4 year cycle low later in the year although it could
have been at the Dec 24 low.
September 21 seems to be the crest of the last Primary cycle and
may be the cycle high for the 4 year
cycle.
The following dates may have
significant moves or start of a move. The following aspects are for a reverse
in trend or large range day.
Jan 13 Jupiter square
Neptune
Vulnerable
to deception and fraud. Things that get overdone.
On
the other hand can be Lucky, shortage of money
Credits
and downgrades`
Due
to retrograde motion this signature will be with us most of the year.
Feb 2 Venus waning
trine Uranus
Venus
stands for values while Uranus corresponds to sudden changes. Could be sudden
changes in stocks or commodities.
Feb 3 Venus enters
Capricorn
A
stated above Venus for values, but also women’s issues and artist’s. Moving into
Capricorn allows Venus to be staid, conservative and part of the Earth element. This could stand for improving diplomatic
relations.
Feb 6 Venus quintile
Neptune.
The
awareness of conflict or problems and the finding solutions for them.
Problems
could be related to money or a misunderstanding of money or the value of currencies.
Any aspects, like those noted
above are a minimum of 3 tds (trading days). Longer term aspects will be noted
separately.
Jupiter square Neptune will be
with us for most of the year. Due to retrograde motion Jupiter will square
Neptune 3 times. This combination can point to an increase in spending,
inflation and potential debt problems and bankruptcies. This could be on and
off all year. Neptune alone is about illusion and delusion. Jupiter can be very
favorable but tends to overdoing things.
What will probably not be favorable
will be Venus conjuncting both Saturn and Pluto in the week of February 18th.

The above aspects are for the
next week. A list of powerful outer planets aspects follows. They will be
covered in detail as we approach them.
Any aspects, like those noted
above are a minimum of 3 tds (trading days). Longer term aspects will be noted
separately. The following list are planet aspects. There will also be Eclipses,
Fixed stars, cycle charts and other Astrological items. The outer planets which are the slower speed planets are the ones that typically have the most effect on financial activity.
Longer Term Aspects
2019 Jupiter square Neptune
2020 Jupiter conjunct
Saturn
Jupiter
conjunct Pluto
Saturn
conjunct Pluto
2021 Jupiter squared Uranus
Saturn
square Uranus
2022 Jupiter conjunct
Neptune
Jupiter square Neptune will be
with us for most of the year. Due to retrograde motion Jupiter will square
Neptune 3 times. This combination can point to an increase in spending,
inflation and potential debt problems and bankruptcies. This could be on and
off all year. Neptune alone is about illusion and delusion. Jupiter can be very
favorable but tends to overdoing things.
What will probably not be favorable
will be Venus conjuncting both Saturn and Pluto in the week of February 18th.

The next hits are Feb 20, 2019 and April 10, 2019.
The 4 Year cycle

The above chart shows the 4 year
(red). The last 4 year cycle trough was Feb 2016. The next 4 year cycle should
be Dec 2019 +- 10 months. See the chart.
From the last few posts:
“This coming year could see an
increase in geophysical activity, both earthquakes and volcanos.”
See the link under
“Earthquakes”. This is an application from the USGS. Geophysical activity has
been picking up.
There has been a number of
volcano’s erupting as well. Japan, Hawaii, Philippines, others.
On a longer term basis the
following monthly chart of the DJIA
shows the 15 year cycle (red
vertical lines) and the 45 year cycle
(blue lines). The 15 year is due now
or took place April – June 2018. The 45
year due in Sept 2019. This is another example of a longer-term cycle
possibly distorting shorter term cycles. Bear in mind they need a broad orb.

Although we do not have enough data the 45 year cycle pointing to Sept 2022
this could also be the 90 year cycle. We do not have enough data to make the 90
year call. For a 90 year cycle I’m
looking at 1842 – 1932 and then 2022.
The following daily chart of
the SP500 shows 2 Envelope channels.
Red is the centered
20 week envelope channel.
Blue is the centered 40 week envelope channel. The dark blue squares are the
Sun / Neptune square which is often a short term change in trend.
We have had this noted it was
due for a sell. Also note the dark blue
squares. They are the dates of the Mars square Uranus transit.

We are entering the difficult time mentioned
over the last few months.
The red averages are based on the 20 week so
they are shifted 10 weeks or a ½ cycle.
I brought up Iran on the last
couple of posts. I’ll come back to those charts on any potential signs of
conflict. It is getting close. Watch the news for problems with Iran.
Other
Other cycles and Astrological
events are the 20 year cycle and heliocentric Jupiter in Sagittarius.
The vertical black lines are
the 20 year cycle. Note the lows. It is due again near March 2022 but it needs
a wide orb.
The blue x’s show when
heliocentric Jupiter is in Sagittarius. This, most often, has the market moving
up. The next chart shows both these items. The aspect Heliocentric Jupiter in
Sagittarius came from MMA. And timing solutions.

2019 Eclipses
See the previous blog post for more details on the eclipses.
Date Eclipse Saros Cycle Sign
Jan 6, 2019 Solar
Partial 122 15Cp25
Jan 21, 2019 Total
Lunar 134 00Le51
July 2, 2019 Solar
Total 127 10Cn37
July 16, 2019 Partial
Lunar 139 24Cp4
Dec 26, 2019 Solar
Annular 132 4Cp6
The Bradley
Indicator
This stock index forecasting tool was designed by astrologer
Donald Bradley and published in 1947 in a booklet titled "Stock Market
Prediction".
On the cover this tool is called the Planetary Barometer and
inside the booklet it is called a Siderograph. Now it is simply called
"the Bradley". The
Bradley is meant to forecast major and minor turning-points
(where a trend will reverse) in either the Dow Jones Industrial Average or
SP500 indexes. Bradley's work was obviously on the DJIA.
It does not forecast or anticipate whether that
turning-point will be a high or a low. It has no polarity. The Bradley may turn
up while the DJIA turns down. The amplitude of the Bradley swing is also not
important. It only finds periods where trend changes occur.
It should be understood Astrologers in decades gone by who
had no computers, spreadsheets, or databases to analyze data typically worked
with much smaller data sets than we do today. This maybe why the Bradley worked
so well when it first came out in 1947 but now is somewhat unreliable. Now, it
goes through periods where it works fairly well but then can stop operating for
months at a time. Originally it was for geocentric astrology (Earth centered)
but there are now heliocentric models (Sun centered) and others.
In Bradley's own words:
"At no time must the reader gain the impression that a
siderograph, as such, is a prediction of what the stock market will actually
do. Nevertheless, observation proves that basic reversals in collective
attitudes, clearly predicted by the line, are inevitably mirrored in stock
averages"
So if the Bradley only identifies trend changes, what are
trend changes?
- a rising market changes to a falling market
- a rising market changes to sideways
- a sideways market starts going up
- a sideways market starts going down
- a market going down changes to a rising market
- a falling market starts going sideways
The red line is the Bradley Indicator.

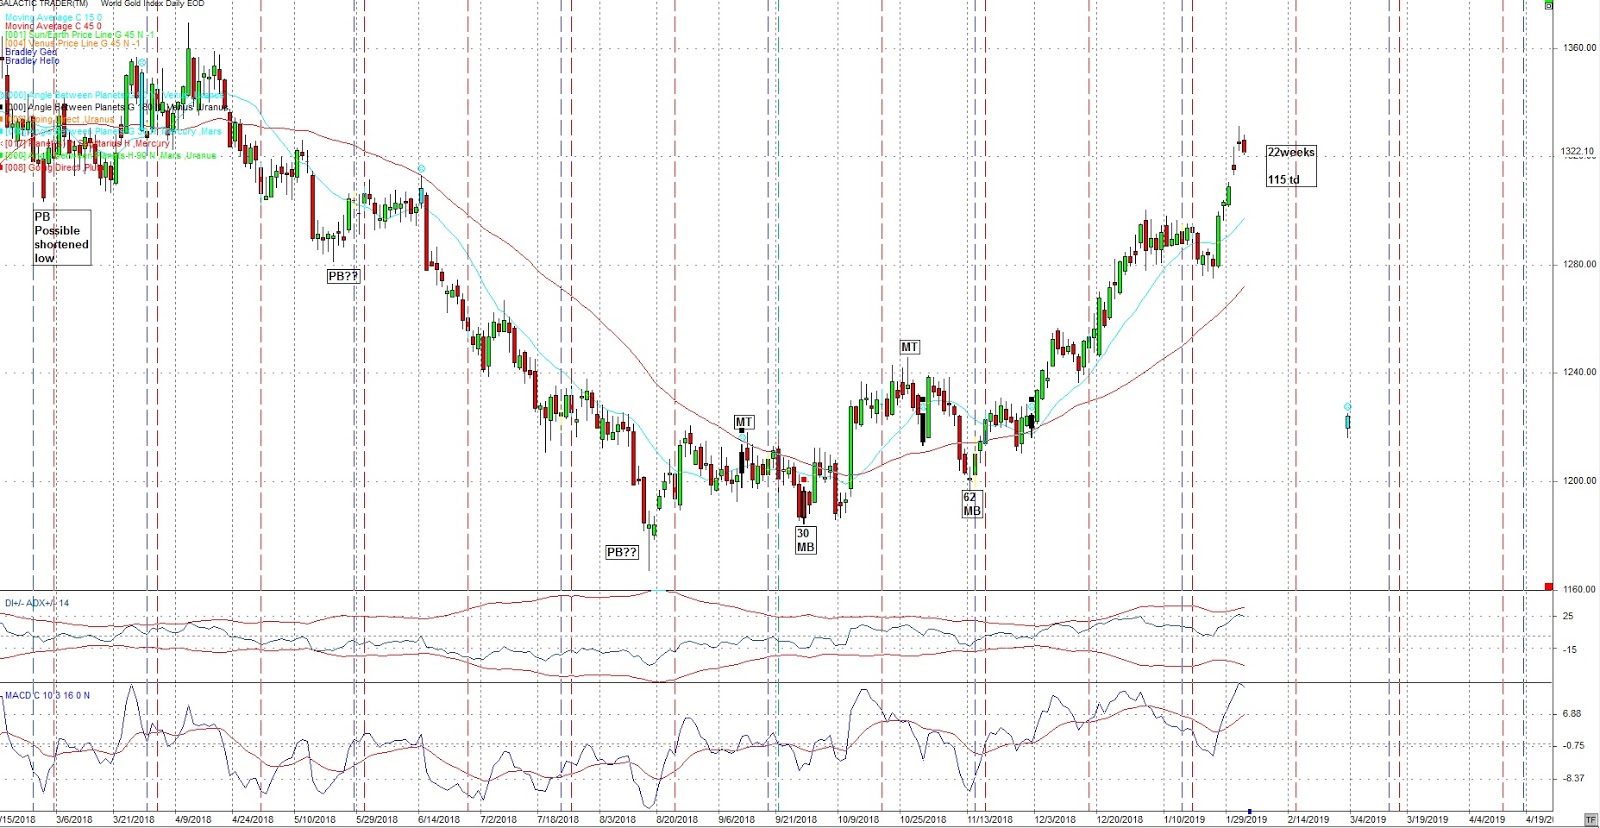
Gold
Gold is 115 td (trading days) or 22 weeks away from the Primary cycle
bottom on Aug 16, 2018.
This could be near the end of the 3nd
6 week cycle. The Primary cycle is
approx. 18 weeks long and we are at the 21st week. I was looking for a
Primary cycle trough in January 2019.
On occasion the Primary cycle can extend away
from it’s more normal 18 week length. This appears to be the case and brings up
a question. Was August 16, 2018 a
Primary Cycle low. This is either incorrect labelling or this is a very right
translated cycle. (Right translated
meaning the high is near the end of the cycle.
I’m looking for a crest in Gold in early February
2019 (we may have just had it).
Gold may be the best performing commodity in
the first half of 2019. Look for a pull back before precious metals moves higher.
I’m expecting a pull back and then up.
The following chart shows two
daily envelope channels. We may see a pullback near early in the week of Feb 4th. The vertical red
lines are a 20 day cycle.

The following chart shows a 27 cd (calendar day) cycle (blue
vertical lines). The last being
Jan 28, 2019. The next is Feb 22, 2019.
The Moon takes 27 days to orbit the Earth and the Sun
takes 27 days to revolve once at the
Sun’s equator.
The red lines headed up are the Mars price lines. Gold had been moving up
and have found both resistance and support at the Mars price line. The darker
red Mars lines are the main aspect. Moving below the red Mars price line was bearish
now we need to move above the red Mars price line as a positive sign for a move
up in Gold. Gold may follow the red, Mars price line up. Watch closely.
The small blue x’s on the chart
show when heliocentric Mercury is in Sagittarius.
We often see changes in trend in Gold when Mercury enters heliocentric
Sagittarius.
Looking at this whole chart it
is based on a 24 harmonic. If you count each line from one darker red line to
the next you will find there are 15 of them. 15 * 24 degrees = 360 degrees.

The following chart shows when
Mars enters a new sign.(red squares). It often affects Gold. Mars is in Aries and changes signs into
Taurus on Feb 14, 2019.
This is just about 18 weeks so
we may see a Primary cycle trough close to this date. Watch for geophysical
activity around this timeframe.

Crude
Oil is recovering from a strong
move down. The low on Dec 24 may be the Primary cycle low and may turn out to
be a larger cycle low.
Price broke through the 45 day
sma and the 15 day sma.
On Jan 13 we had Jupiter square
Neptune. Both are co-rulers of Pisces which rules crude amongst other things.
As mentioned, this square will be seen off and on during 2019. Among other
things this square can indicate a period where things get overdone including
the price of crude. Watch the Fibonacci retracement levels for turning pints.

This puts us entering week 6.
On the next chart note how price
often follows the Sun price line up (green line) and often stops and reverses
at the Sun price line or the Pluto price line (blue). We often get big range days. The red vertical lines are the 40 cd (calendar
day) lines. Crude price often bounce on a Pluto price line (blue) as well.
Watch the green Sun price line
and see if crude follows that price line up and look for a potential turn down
near the 40 day cycle.


And finally, a weekly chart of
crude showing a 17 / 34 month cycle. Red vertical lines. The 17 month cycle
chart is shown below. Note the Fibonacci retracement at 23.6% or 59.41.

Awesome blog information thanks for shareing such post Mcx tips
ReplyDeleteHello everyone..Welcome to my free masterclass strategy where i teach experience and inexperience traders the secret behind a successful trade.And how to be profitable in trading I will also teach you how to make a profit of $12,000 USD weekly and how to get back all your lost funds feel free to email me on(brucedavid004@gmail.com) or whataspp number is +22999290178
ReplyDeleteHello everyone..Welcome to my free masterclass strategy where i teach experience and inexperience traders the secret behind a successful trade.And how to be profitable in trading I will also teach you how to make a profit of $12,000 USD weekly and how to get back all your lost funds feel free to email me on(brucedavid004@gmail.com) or whataspp number is +22999290178