Summary
We are ending the summer period.
The following chart shows the geocentric Bradley indicator. It’s the red
line on the daily chart of the SP500. You can search the blog to find my
description of the Bradley and why we should ignore the apparent trend. It’s
not accurate.
What is quite accurate is the changes in trend. Note
the upcoming dates (blue circles). These are all potential turns dates but
ignore the direction of the red line. Give each occurrence of +- 3 tds.
The August 30 date would appear to be a reversal up and potentially a run at
the All Time High.
So the Bradley trend line was pointed down but price went up when looking
just at the date. In this case Aug 30. The Bradley appears to say the market is
going down between Aug 30 and Sept 9th but the market is headed up.
The markets may continue up (with volatility) until the Sept 9 date.
Trend often changes when the line makes a sharp move or there are 2 dates close
together like Sept 9 and Sept 13.

Also of interest is the vertical blue lines. This is a 54 day cycle. In
Vedic (Indian) Astrology 108 is a sacred number. 54 is 108 / 2 then 54 / 2 =
27. 27 days is the length of time it takes the Moon to circle the Earth. It
takes 2.5 days more for the Moon to catch up to the Earth which has moved 2.5
days and therefore we get to 29.5 days for the orbit of the Moon. In addition
the Sun rotates once every 27 days at the equator of the Sun. The next vertical
blue line which is the
27 cd cycle is on Sept 30.
On August 18 Mars entered
Virgo. This often equates to
powerful market moves. We have covered Mars changing signs in some detail.
Following is a daily chart of the SP500 and the red squares show when Mars
entered a new sign.

Specifically, when Mars enters Virgo the markets have a history of sharp
moves both up and down.
Although we may be looking for a rise in the SP500 next week we are still
due to see the trough of the
Primary cycle in late Sept or early October. I’m also looking at an up and down period as we move through September. First moving up but trending down later in the month.
So up first then down.
We may get another war but I'm
looking at September 9, 2020 and beyond for a major war effort. That day
Mars turns retrograde while squaring the conjunction of Saturn /
Pluto.
SP500
We are entering the 14th
week of a Primary cycle which started on June 3, 2019. In the current
situation I am looking for a crest of the 9 week cycle which we probably
had on July 26. This would be the ½ Primary cycle crest and down.
Looking at the above summary, I would say the markets may move higher
from here but we should keep in mind the Primary cycle is due for a trough late
Sept to early October. It is possible we continue down into mid Sept / early
October. During the month we have a number of signatures which point to a
trough for the SP500. All have a history with the Primary cycle. I think we see
a sloppy move at the start of Sept. We
may see the SP500 break through the all time high but it is not definitive. The following aspects have a history with the Primary cycle. Some have a wide orb.
Sept 8 Sun waning square Jupiter
Sept 10 Sun opposition Neptune
Sept 12 Mars waning square Jupiter
Sept 14 Mars opposition Neptune.
Saturn turning direct just 2 days before the last Jupiter / Neptune square on Sept 21.
Saturn Direct is a signature for the 50 week cycle.
The above aspects are emphasizing the Jupiter / Neptune
square. This is the last of 3 exact squares and may cause the biggest move.
The potent Sun/ Mars conjunction
will be in orb from now until the end of September. This conjunction has a
record of stock market reversals. They are aspecting the forming Jupiter /
Neptune square.
The combination of Sun and Mars
aspecting the Jupiter / Neptune square may result in:
A lack of control
Unreliability
Money losses / speculators
Lack of clarity
Big claims which result in
nothing.
Later in the month there are
other aspects which could affect when the Primary cycle will hit it’s trough.
Watch for the 27 CD (calendar day) cycle when I mention it.
I’m looking at the period of Sept
18 where we have Saturn turning direct through Sept 21 where
we have the last Jupiter / Neptune square. This period could either mark
the start of the move down to the Primary trough or be the Primary trough.
Truth will be hard to find during this period.
Jupiter square Neptune which we have mentioned numerous times may
be the real problem as these planets in aspect can be quite inflationary. With
Neptune involved we may not be getting the truth. This may be pointing to serious financial problems late 2019 or early
on 2020.
Following is an up to date daily
chart of the SP500.
Much of the market’s movement
will be due to the extent of the trade wars between China and the US.
Notice at the bottom of the
chart. The light blue line is the 39 or 40 week cycle. It is due to hit the
trough around October 2nd. I’m looking for the Primary cycle
trough mid Sept to early Oct. We call the Primary cycle the 18 week cycle.
It typically lands in the 15 week to 21 week time frame.

Price is now above the 15 day sma and the 45 day sma. We seem to have
broken through the sideways consolidation.
The Jupiter / Neptune
square is still in scope and the effects are still being felt. The next and last square is Sept 21. The
Saturn / Pluto conjunction is also still in orb. Both will come back to
exact conjunction.
Following is the envelope
channel chart for the SP500. The envelope are centered moving averages. Note
price made a low in August and bounced off the 20 day envelope.

Centered moving averages are used to find cycles.
Gold
Gold is entering the 15th
week of the 18 week Primary cycle.
We are in the third and last 6 week cycle of the 18 week cycle. I’m looking at Sept 6 as the top of this Primary cycle. When moving down I look for the box.
In this case the box is 38.2% to
50.0% retracement.
The Jupiter going Direct signature on Aug 11 is often associated with
crests in gold prices. The crest appears to be Sept 6.
The Uranus Retrograde signature is also more frequently associated
with crests in gold or big range days. It turned retrograde on Aug 11.
When commodities are moving with such strength it is difficult to see a
turn. Price has just come down to the 15 day sma. It may bounce here, on Sept 3
+-.
From last blog post:
“Gold may have an up day on Sept
3.”

From last week:
“We may see moves in Silver Aug
26-28 and possibly Aug 28 for Gold.”
Like the SP500 Gold will be affected by the Jupiter / Neptune square.
Review the items listed under the SP500, lack of control etc. Untruths and unreliability
will be common. The Saturn Direct signature may be signaling the Primary cycle trough for Gold. Anytime during the week of the Sept 16.
Crude's
We had the Primary Cycle trough for
crude oil on June 5th and are entering the 13th
week of a new Primary cycle. Notice the green symmetrical triangle
providing support and resistance. Crude price quickly broke the bottom of the
symmetrical triangle. Crude will either break above or below the symmetrical
triangle over the next week. Crude has a dual rulership of both Jupiter and
Neptune and will be directly affected by the Sept 21 Jupiter / Neptune square.
I’m looking for crude to move up
as we get closer to the point of the symmetrical triangle. Crude, like the
SP500 and Gold will be strongly affected by the coming aspects. I’m looking for
crude to break up from the triangle.
Crude may be quite volatile over
this month. Obviously, the price of crude will go up if relations with Iran
worsen. I’m expecting a rise in crude oil price by the fall timeframe.
Will China buy crude from Iran?

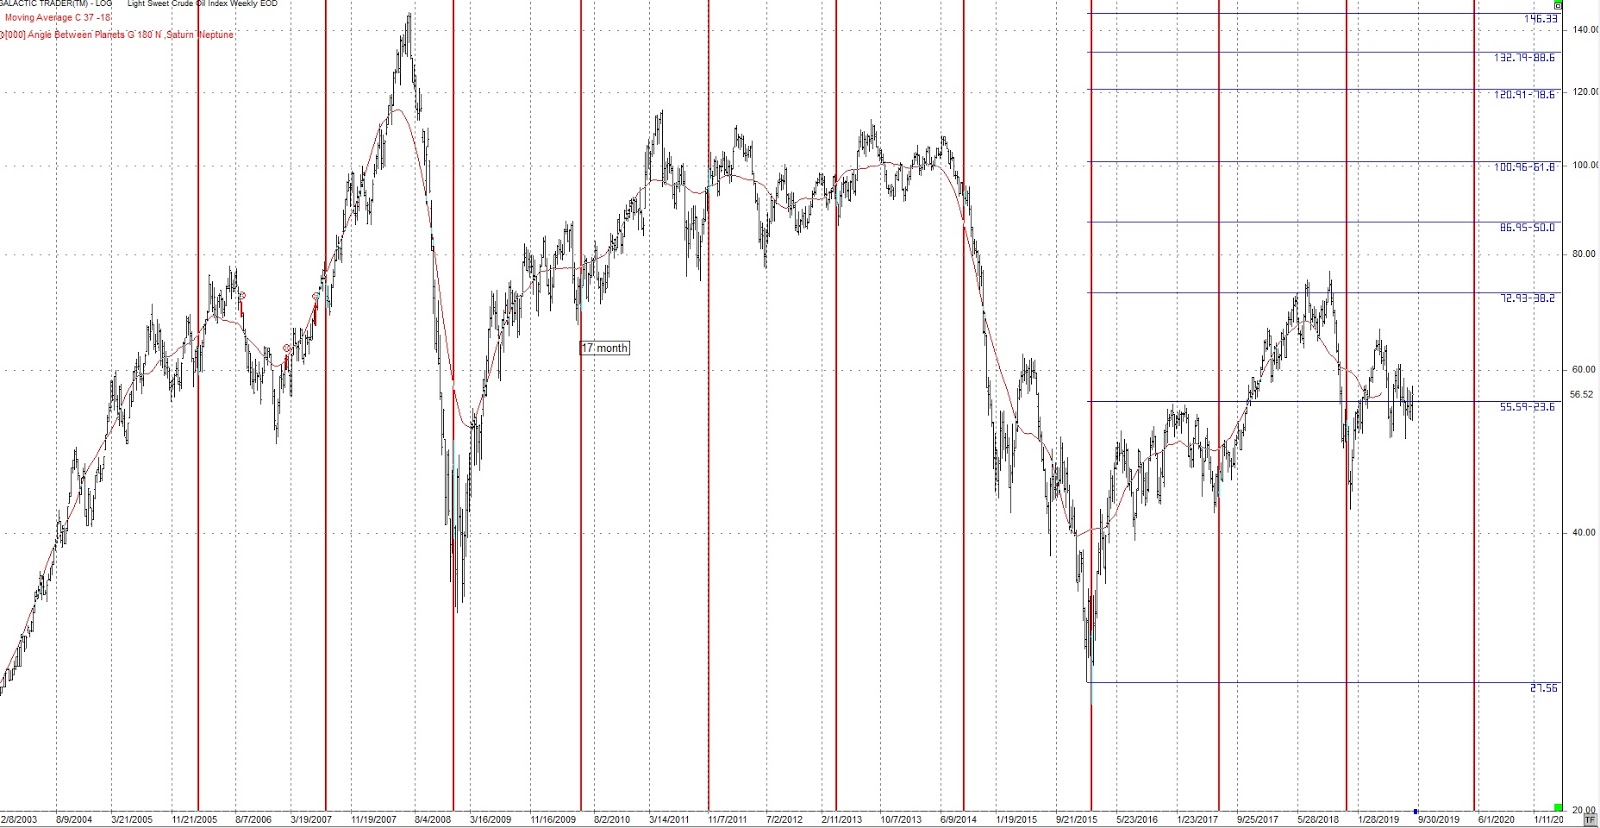
Following is the crude chart with
the 17 month cycle. It’s due early May 2020.
No comments:
Post a Comment