- Our first half 2016 forecast dates are available
- Subscriptions include the forecast dates and a monthly Market letter with eMail alerts for imminent trading opportunities
- We do not use negative option billing nor do we sell email addresses
- Subscriptions include the forecast dates and a monthly Market letter with eMail alerts for imminent trading opportunities
- We do not use negative option billing nor do we sell email addresses
SP500
The following is a change from
last week. For the SP500, cycle-wise Jan
20th looked like it was the Primary cycle trough. 1
cycle that started
on Aug 24th. However, Feb 11th
was a slightly lower low than Jan 20th. Feb
11th was either a double bottom to the Jan 20th nominal 18 week cycle low
or Feb 11 is the start of the start
of a new 18 week cycle and Jan 20th
was a double bottom.
The distinction is important. If Jan 20th is the nominal 18 week low
then the Feb 11 low is very bearish. Typically the new nominal 18 week cycle
has put in it's highs for the cycle. This would be very left translated and
bearish. If Feb 11 is the nominal 18
week cycle trough then we should be starting a new nominal 18 week cycle. The
latter is more bullish. The former more bearish. We are already bearish just
due to the fact that either date mentioned is lower than the previous 18 week
cycle low on Aug 24, 2015. However, double bottoms, and we have one here, are
normally bullish so the charts aren't being helpful, giving both bearish and
bullish indications.
My outlook is bearish going into
the Spring due to the Astrological aspects being formed, namely the Saturn / Neptune square and the Jupiter / Saturn square. There are
others. The Saturn / Pluto square is
still in orb but will soon be fading. March through June of 2016 looks troublesome
and bearish.
To summarize, I'm bearish. Bear markets, like we are in
often have violent rallies. We have seen a few. Please note; with the many heavy
Astrological transits coming up we may have a distorted Primary cycle. I'm
expecting a volatile environment in the markets. I'm also expecting geophysical events, possible violent
weather and potential terrorist event. Sounds like fun!

In our cycle work we use td
(trading days) and cd (calendar day) cycles. Feb 5th was
180 td's from the
"All Time High" on May 20, 2015 at 2134.72. This is basic GANN work which we'll use many
times. The 180 td cycle from a high often results in a low 180 td's later and
vice versa.
Next week, Feb 15 has a 45 cd cycle
which also started on May 20th, 2015.
This cycle has marked very reliable CIT's (Change In Trend) since May 20th. I
was expecting Feb 15th to be a high. With the Presidents Day holiday in the US this would
be Feb 12 or 16th. Feb 16th, the
next day the US
markets are open, has the Sun
quintile Saturn an aspect with a history of isolated lows 70% of the time.
Feb 16th also has heliocentric Mars squaring Pluto an aspect with a history of
isolated highs 73% of the time (based on 41 events). I look at the opening (1st
couple of hours) as being very important. The two aspects just discussed may
result in continued volatility.
The 45 cd cycle is shown below.
It's a daily chart of the SP500. The purple vertical lines are the 45 cd cycle.
This is referred to as an 8th harmonic cycle, simply 360 / 8 = 45. Note: This
cycle has been very reliable since May 20, 2015 and found at both highs and
lows. Review the chart and always consider +- 2 td's and you will see it's been
present on some big moves.

I believe we are close to longer
term cycle bottoms, both the 6.5 - 7 year cycle and the Kitchin cycle, 3.3
years (or 40 months). Assuming January 20th was not it, then we may see a left
translated cycle, that is a Primary cycle which forms it's crest in the first
half of the cycle. This is a bearish sign. Look for this over the next 9 weeks.
Subscribers have the time-frame where I think we will have a more significant
low.
Before we get to that low there
may be a financial event around Feb,
26th. This is an Astrological event which marks the start of a time period
where there could be major changes to the U.S. 's financial system. This is a
long term event, although we could see some effects around Feb 26 this should
be +- a couple of months. The video has more information.
See the following VIDEO. Possibly Important
To summarize the above:
Volatility should continue. This coming week has the Sun and
Venus changing signs, the Sun into
Pisces, a mutable sign and Venus
into Aquarius, a fixed sign. We also have heliocentric Mercury entering Sagittarius on Feb 15 through Feb
26th. We often see large price moves when Mercury is in Sagittarius in stocks
and particularly precious metals. Will this time period end the sharp move in
Gold? Planets changing signs effect the
markets often resulting in a change in trend. I'm looking for this coming week to be down, into Friday or at least
end lower than it started. If the markets move sharply higher it could be a
longer term up move. Instead of down, if we see the markets start moving up early next week the rise should be contained and only rise into Feb 18, 19. The following week we should continue moving down.
With the volatility we've seen one might expect the markets
to settle down. Looking at the coming months, from an Astrological perspective,
we may be getting more volatile. The major aspects coming up from March through
June will be covered in the next
subscribers report, March 1st. These will tie in with the forecast dates
sent to subscribers in early January 2016 or when signing up. For example Mars
will enter Sagittarius on March 5th joining Saturn. This is a classic war
signature.
With the sharp market moves, up and down, we should consider
one or more of the longer term cycles are coming down to enter their trough.
Note the longer term charts we have shown for many months, specifically the Kitchin
cycle (40 months) and the 6.5- 7 year cycle. The longer term cycles typically
pull everything down with them. This can be a process that takes many months. They
can also distort the normal rhythm of the 18 week cycle. I'm looking in the
April / May time frame for a more significant low.
With these longer term cycles we use the Astrological
aspects and Astro events to determine a more exact time. Longer term geocentric
Astrological cycles include:
Uranus waning square
Pluto
- passed the exact but still in orb (1 degree). This square
will slowly dissipate over this year.
Remember what this square is about.
"This aspect has a historical association between
anarchic uprisings and problems with
debt and Banks. The debt issue will have major negative consequences for all
financial markets.
Other events associated with this square are protest
movements, social unrest and perhaps mob violence. Tax revolts fit in as well.
The square is about tearing down the
old structures (governments, financial institutions) and building anew. Although Uranus is about sudden
change and surprises, Pluto is about long term changes that will not be undone.
It is ruthless in it’s force to change the status quo. We are only 1 degree
away from the exact Uranus and Pluto square."
Jupiter waning square
Saturn
- in the middle of a 3 pass, 2 exact hits to come this year
"The business cycle and direct effect on European
history. Major changes will be occurring in Europe
as result of the refuge migration. There is a major sign change coming up when
Jupiter and Saturn are conjunct in 2020. More on this 240 year conjunction in a
future post."
Saturn square Neptune
-in the middle of a 3 pass, 2 exact hits to come this year
"This aspect is often present near times when there is
a change in trend for interest rates or inflation. It can also be a period of
epidemics, pandemics suffering, depression and money valuation problems. This
could be a change in the world's reserve currency or issues around it. A large
increase in precious metals is also possible as it is a money valuation issue.
This 36 year aspect has been associated with political changes, reforms and
development of socialism. One wonders in regards to epidemics and sickness,
would this be natural illnesses or man-made." If you feel depressed or not
at ease this aspect may be the cause. One of these planets may be hitting a
planet in your horoscope.
On
the following weekly chart of the DJIA, the red squares are Jupiter square Saturn. An ideal spot
for a significant low would be between the last 2 red squares at March 23rd to May 26th. Note the green
squares also. These are the Saturn /
Neptune exact squares and the middle square is very close to the last
Jupiter / Saturn square. Saturn is the common planet here. Among other things
Saturn is fear.

For
2016 we have Jupiter, Saturn, Neptune and the North Node in mutable signs. In addition both Solar
eclipses are in mutable signs. Mutable signs are about flexibility and the ability
or need to change.
Saturn is in Sagittarius which
rules the law, religion, philosophy and science. With the square to Neptune is a good signal for a religious message that
gets perverted. It's a time period where things seen depressing.
Charts we have not shown for awhile.
The first 3 charts are daily charts of the SP500, the Russell 2000 and the
NYSE. The horizontal blue lines are the average longitude of the planets
Jupiter, Saturn, Uranus, Neptune and Pluto on all 3 charts This average is
converted to price and displayed on the charts. Notice how well they have acted
as support and resistance. Will the SP500 reach the next level at 1879 or fall
back to 1833.


The other chart we haven't shown
for a while is this Fan which started on March 6, 2009 at the low. The dark
blue line has acted as support most of the way up. It is the 50% line or 45
degrees. The red line we have just touched is 61.8%. It hasn't been touched
since Oct. 2011. The black vertical lines are 512 cd's (calendar days) which
next falls on March 9, just one day
away from a powerful Solar Eclipse. This is potentially a low.

Other longer term cycles that may
be close to seeing their lows in the next couple of months are the 6.5 - 7 year
cycle and the Kitchin cycle (40 months). I'm looking at the period from now through the spring of 2016 as a
potential time period for these cycles. They are long term cycles and need a
broad orb.
Following is the Kitchin cycle on
the SP500 chart. This is a monthly chart. The Kitchin cycle is 1/4 of the synodic
Jupiter / Uranus cycle.

Other long term cycle due,
including the 6.5 - 7 year.

The following weekly chart shows
the 21 and 34 weekly moving averages and the fact price broke through both
averages Also the 21 and 34 week moving averages are pointing down.
The question is, do we have a significant low in front of us.
At this point I think yes. I'm thinking potentially
deeper in the spring time frame in 2016.

The next couple of months may see
more significant geophysical activity and terrorist events.
”Behind the wall, the Gods play with numbers"
-- Le Corbusier
-- Le Corbusier
Gold
Gold put in a Primary cycle 1
trough on July 24th and we had another Primary
cycle trough on Dec 3rd. 2015 which has
marked an important low.
It sure was.
This puts us entering the 11th week of the Primary cycle and entering the 5th week of the 2nd nominal 6 week cycle during this coming week. The nominal 6
week cycle has a range of 5 to 7 weeks. We may be near the peak of this cycle.
As we've mentioned before Mars in Scorpio often results in big moves in Gold both up and
down. Mars entered Scorpio on Jan 3,
2016 and will leave Scorpio for
Sagittarius on March 5, 2016. Due to retrograde motion Mars will be back in
Scorpio later in the year.
In addition to Mars in Scorpio heliocentric Mercury will enter Sagittarius on Feb 15th and will
leave Sagittarius on Feb 26th, the date mentioned in the video above under the SP500.
We often see large price moves when Mercury is in Sagittarius in stocks and particularly precious metals. Will this
time period end the sharp move in Gold?
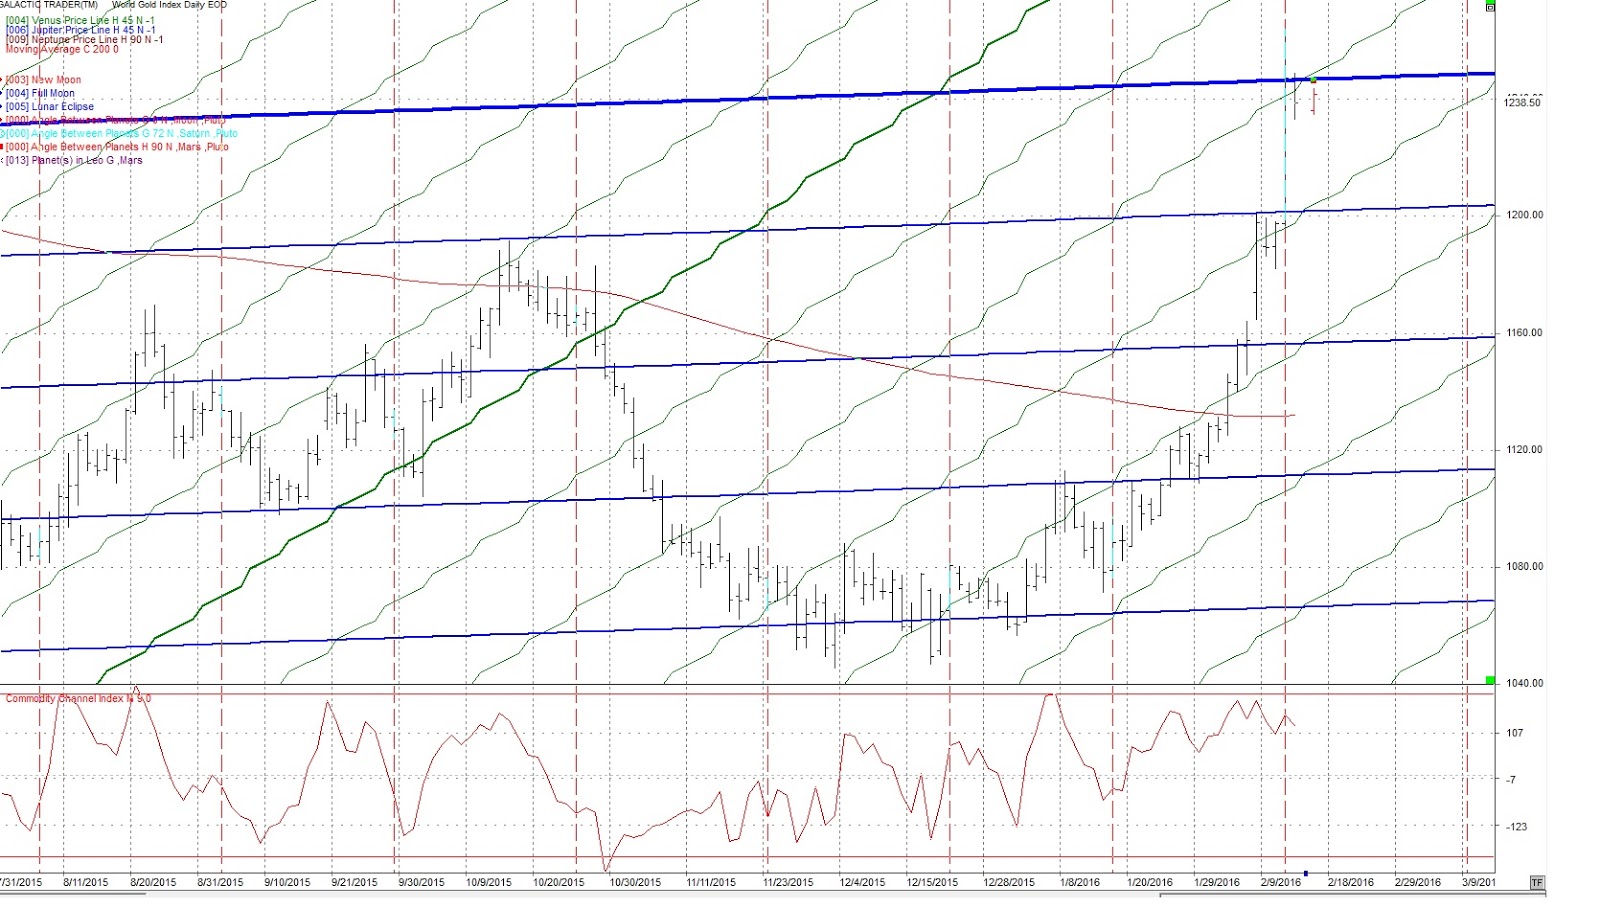
Watch the fib retracements on the following chart for both
support and resistance areas.

I'm still looking for
the time period around Feb 15th to be a high in Gold. Feb12 had the 180 cd
cycle which is also a signal for a turn. It's on the above chart.
The following daily chart for Gold shows the heliocentric
Mercury in Sagittarius (red x's). It also has a 22 cd cycle you can see in the
bottom right area of the chart (orange vertical lines). If active it hits Feb 29th. Watch for Gold pullback.

I'm expecting a bigger move in Gold later in the year,
possibly at the end of this Primary cycle which may also be a 17 month cycle
low. The move should be up. Again, subscribers have the potential dates.
The price lines take the longitudinal position converted to
price. Venus (green) and Jupiter (blue) have provided good support and
resistance. Gold was stopped and is very close to the Jupiter price line. This
is a potential pullback area. We are also over the 200 day sma.
Crude
The week of Feb 8th had
another lower low and is now marked a Primary cycle trough. It was on Feb 11th
which has us in the 1st week of a new nominal 18 week cycle. Bear in mind there
are geopolitical issues affecting crude which can effect the price quickly and
directly. With this in mind we could go lower.
I've been looking for Astrological aspects that hit Jupiter
or Neptune. Both are co-rulers of crude. There is one on Feb 28th when the Sun
conjuncts Neptune . This is particularly
powerful as Neptune is in Pisces, the sign
that it rules.
Many commodities and financials should be affected by the Saturn / Neptune waning square this
year. This is a 3 pass with the last 2 occurring mid-Year and then September
2016. This is a 36 year cycle so looking back 36 years we had severe problems
with the lack of crude and interest rates went over 20%. Things are never the
same, but often close as we now have an abundance of crude and very low (negative?)
interest rates approximately 36 years later. These longer term aspects color a
period of history rather than a day, week or month.
Looking at the crude chart we see a Primary cycle low now on
Feb 11. This is an example of a left
translated cycle with the crest forming closer to the beginning trough. Left
translated cycles are bearish, they simply spend more time going down than
moving up. After 7 years of QE in the U.S. and loose monetary policy we
haven't seen many left translated cycles for some time.
We are now in the 1st week of a new nominal 18 week cycle. I've
mentioned before when a Primary cycle trough is formed it is usually bullish
and we typically get a short dip cycle 2 - 3 weeks after the 18 week cycle
trough. This gives traders the opportunity to get in if they missed the
original trough. In this market this is a good strategy as the 18 week low
could be lower a number of times as we wait for geopolitical events to unfold.
I'm in Canada where there appears to be some good buys but I'm
waiting until I see a move above the Jan 28th high before considering even a
short term trade.

Other items, more specifics on the SP500, Gold and crude
also US$, NatGas, Coffee reserved for subscribers. At $99.00 for a 6 month subscription, can you afford not to have it?
The 1st half 2016
dates and subscription to the monthly letter (starting in Jan) are available
for purchase.
Every week end.
ReplyDeletelower low within this month?
ReplyDeleteI'm looking for the markets to move down into next week. Not sure if this will be lower than Feb 11.
ReplyDelete