Our posts are now reported on the highly regarded FXStreet.com.
Summary
SP500. Volatility continues. I’m looking for a move up early next
week. The two Neptune Astro events appear to have resulted in a double bottom
also known as a “W” bottom. Let's not rejoice as we could go down lower.
Review the daily chart of the
SP500 further down. Other things that can affect the markets are interest rates.
The FOMC announcement on Dec 19 is important as is their outlook on rates going
forward. Remember Jupiter is now in Sagittarius which may have an inflationary
effect. All things legal and the courts should start to have more of an effect.
These same two Astrological events may have a positive an effect on crude as
well.
Gold is still under the effect of Mars entering Pisces om Nov 15th.
Nov 19 has Mars square Jupiter. The Venus opposition to Uranus on Nov. 30 has a
strong history of moves in Gold. On the
Gold chart we have just put in the 3rd, 6 week low in the Primary
cycle. I’ll be looking for a Primary low in 5 to 6 weeks. The last 6 week of a
Primary cycle is often the most volatile.
Crude's Primary cycle appears to have shorten a bit. I was still
looking for a low in Crude around either Nov 24 where Neptune is Direct and watch,
Dec 5th the Sun is in waning square to Neptune. The Saudi’s are
producing record amounts causing a glut in the market and lower prices. Crude
looks like it could go lower.
SP500
The last Primary cycle trough started
on June 28, 2018 and may have
completed it’s Primary cycle trough on Oct.
29, 2018. Please note, this is not definite and we could have a secondary
pull back so the Primary cycle trough is not firm yet. Markets should continue
to be volatile next week. As noted above we often see a double bottom when
Neptune turns Direct.
If that was the Primary cycle
low then we are beginning the 5th
week of a new Primary and getting close to a 6 week low.
We don’t want to see a close
below Oct 29 low or worse below the Feb 9th low We are still in a
period of volatile congestion.
The recent move down was timing
the 18-week Primary cycle and a 2 year cycle. The longer term cycles (2 year)
can distort the smaller term cycles (18 week).
September 21 seems to be the crest of the last Primary cycle and
may be the high for the
4 year cycle.
The following dates may have
significant moves or start a move. The following aspects are for a reverse in
trend or large range day. volatile week.
Nov 30 Venus opposition
Uranus
Most
often a signature for a trough +- 7 tds.
Dec 2 Venus inters
Scorpio
Dec 5 Sun waning
square Neptune
More often a trough
than a crest.
Dec 6 Mercury Direct
End
of unpredictable period.
Dec 7 Mars conjunct
Neptune
Rejection,
denial, destruction, infection, rumours
As usual dates are a minimum +-
3 tds unless otherwise noted. On longer timed aspects a time frame will be included.
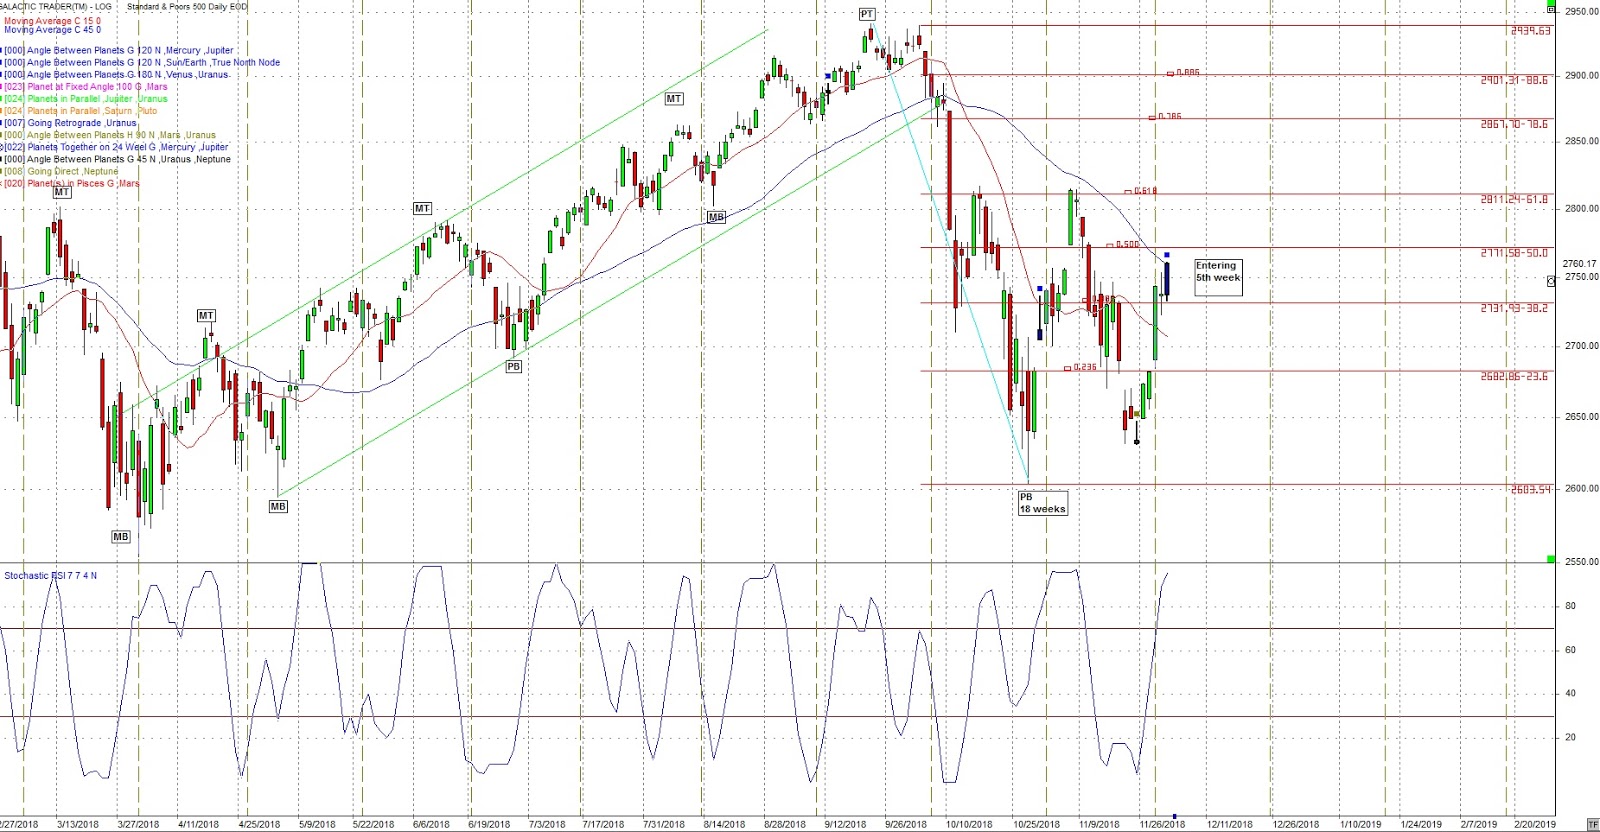
Price is now above the 15 sma
and price is almost on the 45 sma.
Note: from last week.
The low of the day on Nov 9
was exactly on the 23.6% retracement.
Notice we have a number of gaps. They are on the SP500, DJIA and Nasdaq. Gaps
tend to be filled meaning the markets would have to move lower at some point to
fill the gaps.
Those Gaps have been filled
The following daily chart of the
SP500 is what we have been showing under the 24 Harmonic chart. This is the
basis of what we have been forecasting on.
Following is the 24 Harmonic
chart we have shown for many months.

The next hits are Jan. 2, 2019 and Feb 20, 2019. The
latter number is on the Uranus price line. Watch closely.
The 9 month cycle

The above chart shows the 9
month or 39 week cycle (blue vertical lines). It was due and appears to have
formed in late October. The 20 week cycle was added as well (red vertical lines).
Any green lines are a combination of the 20 and 40 week cycles. The 20 week cycle was only 1 day away from
the sharp move down.
The next 40 week cycle is early February
2019.
From the last few posts:
“This coming year could see an
increase in geophysical activity, both earthquakes and volcanos.”
See the link under “Earthquakes”.
This is an application from the USGS. There was a significant earthquake in
Alaska today.
There has been a number of
volcano’s erupting as well. Japan and Hawaii.
On a longer term basis the
following monthly chart of the DJIA
shows the 15 year cycle (red
vertical lines) and the 45 year cycle
(blue lines). The 15 year is due now
or took place April – June 2018. The 45
year due in Sept 2019. This is another example of a longer-term cycle
possibly distorting shorter term cycles. Bear in mind they need a broad orb.

The following daily chart of
the SP500 shows 2 Envelope channels. Red is the centered
20 week envelope channel.
Blue is the centered 40 week envelope channel. The dark blue squares are the
Sun / Neptune square which is often a short term change in trend.
We have had this noted it was
due for a sell. Also note the dark blue
squares. They are the dates of the Mars square Uranus transit.

We are entering the difficult time mentioned
over the last few months.
The envelope channel charts are easy to
calculate. In the above case the blue lines are based on a 40 day average but
when they are plotted they are centered. For a 40 day it will be shifted by 20
days which is the ½ cycle.
The red averages are based on the 20 week so
they are shifted 10 weeks or a ½ cycle.
I brought up Iran on the last
post. I’ll come back to those charts on any potential signs of conflict. It is
getting close. Watch the news for problems with Iran.
4 Year
Other longer-term aspects
like the 4 year cycle are coming
due. The SP500 4 year cycle should be due in mid to late 2019.
The Primary cycle top on Sept 21, 2018 at 2490.91 may have
been the top for the 4 year cycle. This is not confirmed.
Other
Another very long term cycle,
the 90 year, is potentially around 2022 +- a lot. More time is needed to
confirm this cycle. The ½ cycle to the 90, the 45 year ties into the 90 and is
due in the same time frame.
Gold
Gold is 74 td (trading days) away from the
Primary cycle bottom on Aug 16, 2018. This could be near the end of the 3nd
6 week cycle.The Primary cycle is approx. 18 weeks long.
The Primary cycle in Gold has been difficult to
ascertain. There was a Primary cycle trough on Dec 12, 2017 but determining the
next Primary trough has been very difficult.
We may have seen a low on Aug 16th but it must be confirmed. This was 4 trading
days after the Lunar Eclipse on Aug 11.
On occasion the Primary cycle can extend away
from it’s more normal 18 week length.
I’m looking for a crest in Gold probably during
December but Gold could go further up.
Seasonally Gold is usually flat over the early
summer months with a history of moving up starting in August.

Price is now just above the 15 sma and the 45
day sma.

The following chart shows two
daily envelope channels like the chart for the SP500 above. The blue squares
are the aspects duplicate the transits noted above. I have noted the key dates on the chart.

The following chart shows a 27 cd (calendar day) cycle (blue
vertical lines). The last being Nov 6,
2018. The next is Dec 3rd.
The Moon takes 27 days to orbit the Earth and the Sun
takes 27 days to revolve once at the
Sun’s equator.
The red lines headed up are the Mars price lines. Gold had been moving
sideways and have found both resistance and support at the Mars price line. The
darker red Mars lines are the main aspect. Moving below the red Mars price line
was bearish now we need to move above the red Mars price line as a positive
sign for a move up in Gold. Gold may follow the red, Mars price line up. Watch
closely.
Remember the list of aspects
that could affect Gold above.
The small blue x’s on the chart
show when heliocentric Mercury is in
Sagittarius. We often see changes in trend in Gold when Mercury exits
heliocentric Sagittarius.
Looking at this whole chart it
is based on a 24 harmonic. If you count each line from one darker red line to
the next you will find there are 15 of them. 15 * 24 degrees = 360 degrees.

The following chart shows when
Mars enters a new sign.(red squares). It often affects Gold. Mars is moving
into Aries on Dec 31..

Crude
Oil put in a top on Oct. 3rd.
I’m looking at some longer term cycles and technicals to get a handle on future
direction.
Price is now lower than the Feb
5th, 2018 low of the Primary cycle. This can be very telling for crude. Watch
this for a possible bear market starting in crude.
June 18 was the date Neptune turned Retrograde and has been moving
backwards until November 24th
when Neptune turns Direct.
Watch the following dates for
Crude
Nov 24 Neptune Direct
Nov 29 Jupiter
semi-square Pluto
Dec 5 Sun waning
square to Neptune.
Dec 6 Mercury Direct
End
of unpredictable period.
Dec 7 Mars conjunct
Neptune
Rejection,
denial, destruction, infection
Note the planets that rule crude,
Jupiter and Neptune, from the list above. We could be looking at a turn in
crude.

On the next chart note how price
often follows the Sun price line up (green line) and often stops and reverses
at the Sun price line or the Pluto price line (blue). We often get big range days. The red vertical lines are the 40 cd (calendar
day) lines. Crude price often bounce on a Pluto price line (blue) as well.
Watch the green Sun price line
and see if crude follows that price line up.

And finally, a weekly chart of
crude showing a 17 / 34 month cycle. Red vertical lines. The 17 month cycle
chart is shown below.

Great call on the market direction. Are we following the foot steps of the 90-year cycle - 1928? This means end of 2019 is BIG trouble.
ReplyDeleteI was looking at 2022 +- a number of years for the 90 year cycle. Remember, we have only 3 and possibly 4 incidence. I'm using the 45 year, the 1/2 cycle to the 90 years.
ReplyDeleteMARS CONJUCT NEPTUNE=
ReplyDeleteCRASH TOMOROW? PEARL HARBOR ON WST
Mars is conjunct Neptune tomorrow and we could be down but I don't see a crash. This happening is PISCES. With the other Astros we could see a geophysical event. If so it may be under water.
ReplyDelete